ROCK R3 Pro Accuracy Case Study: Airport Runway Mapping
Jun 15, 2023
Today, we're diving deep into an exciting and enlightening accuracy case study conducted using our very own ROCK R3 Pro LiDAR and the ROCK Cloud software.
Introduction to the ROCK R3 Pro and ROCK Cloud
Firstly, let's take a moment to appreciate the gear that makes it all happen. The ROCK R3 Pro is our advanced LiDAR camera built specifically for drones, handheld SLAM, and mobile LiDAR mapping. Combining robust construction, top-tier tech, and pinpoint accuracy, it's a dream tool for geospatial professionals.
Complementing the R3 Pro is our best-in-class LiDAR processing tool – ROCK Cloud. It allows you to convert, visualize, analyze, and share your LiDAR data with a user-friendly interface, streamlining data processing and enhancing productivity. Now, on to the case study.
Why an Airport Runway?
Airports runways - flat, open, and obstruction-free. These unique characteristics make them the perfect testing ground to assess the accuracy of our LiDAR system. The absence of buildings, vegetation, and other disturbances enables the ROCK R3 Pro to work its magic, capturing and detailing every nuance with flawless precision. So, we decided to put our gear to the test on an expansive airport runway.
The Experimental Setup
For this study, we configured the drone to hover at an altitude of 50 meters Above Ground Level (AGL). This height is optimal for obtaining the finest level of detail while maintaining coverage efficiency. Moreover, we set a 50% flight line overlap, ensuring comprehensive data collection.
To collect RTK check shots, we employed an EMLID Reach RS2 Base and Rover pair, conveniently set up over a nearby NGS monument. However, today's workflows can be even more streamlined using a local ROCK Base and our ROCK RTK network. Thanks to this setup, we gathered an impressive 172 check shots, each boasting an astonishingly low error range of just 0.03 feet!
Digging Deeper: The LiDAR Data Analysis
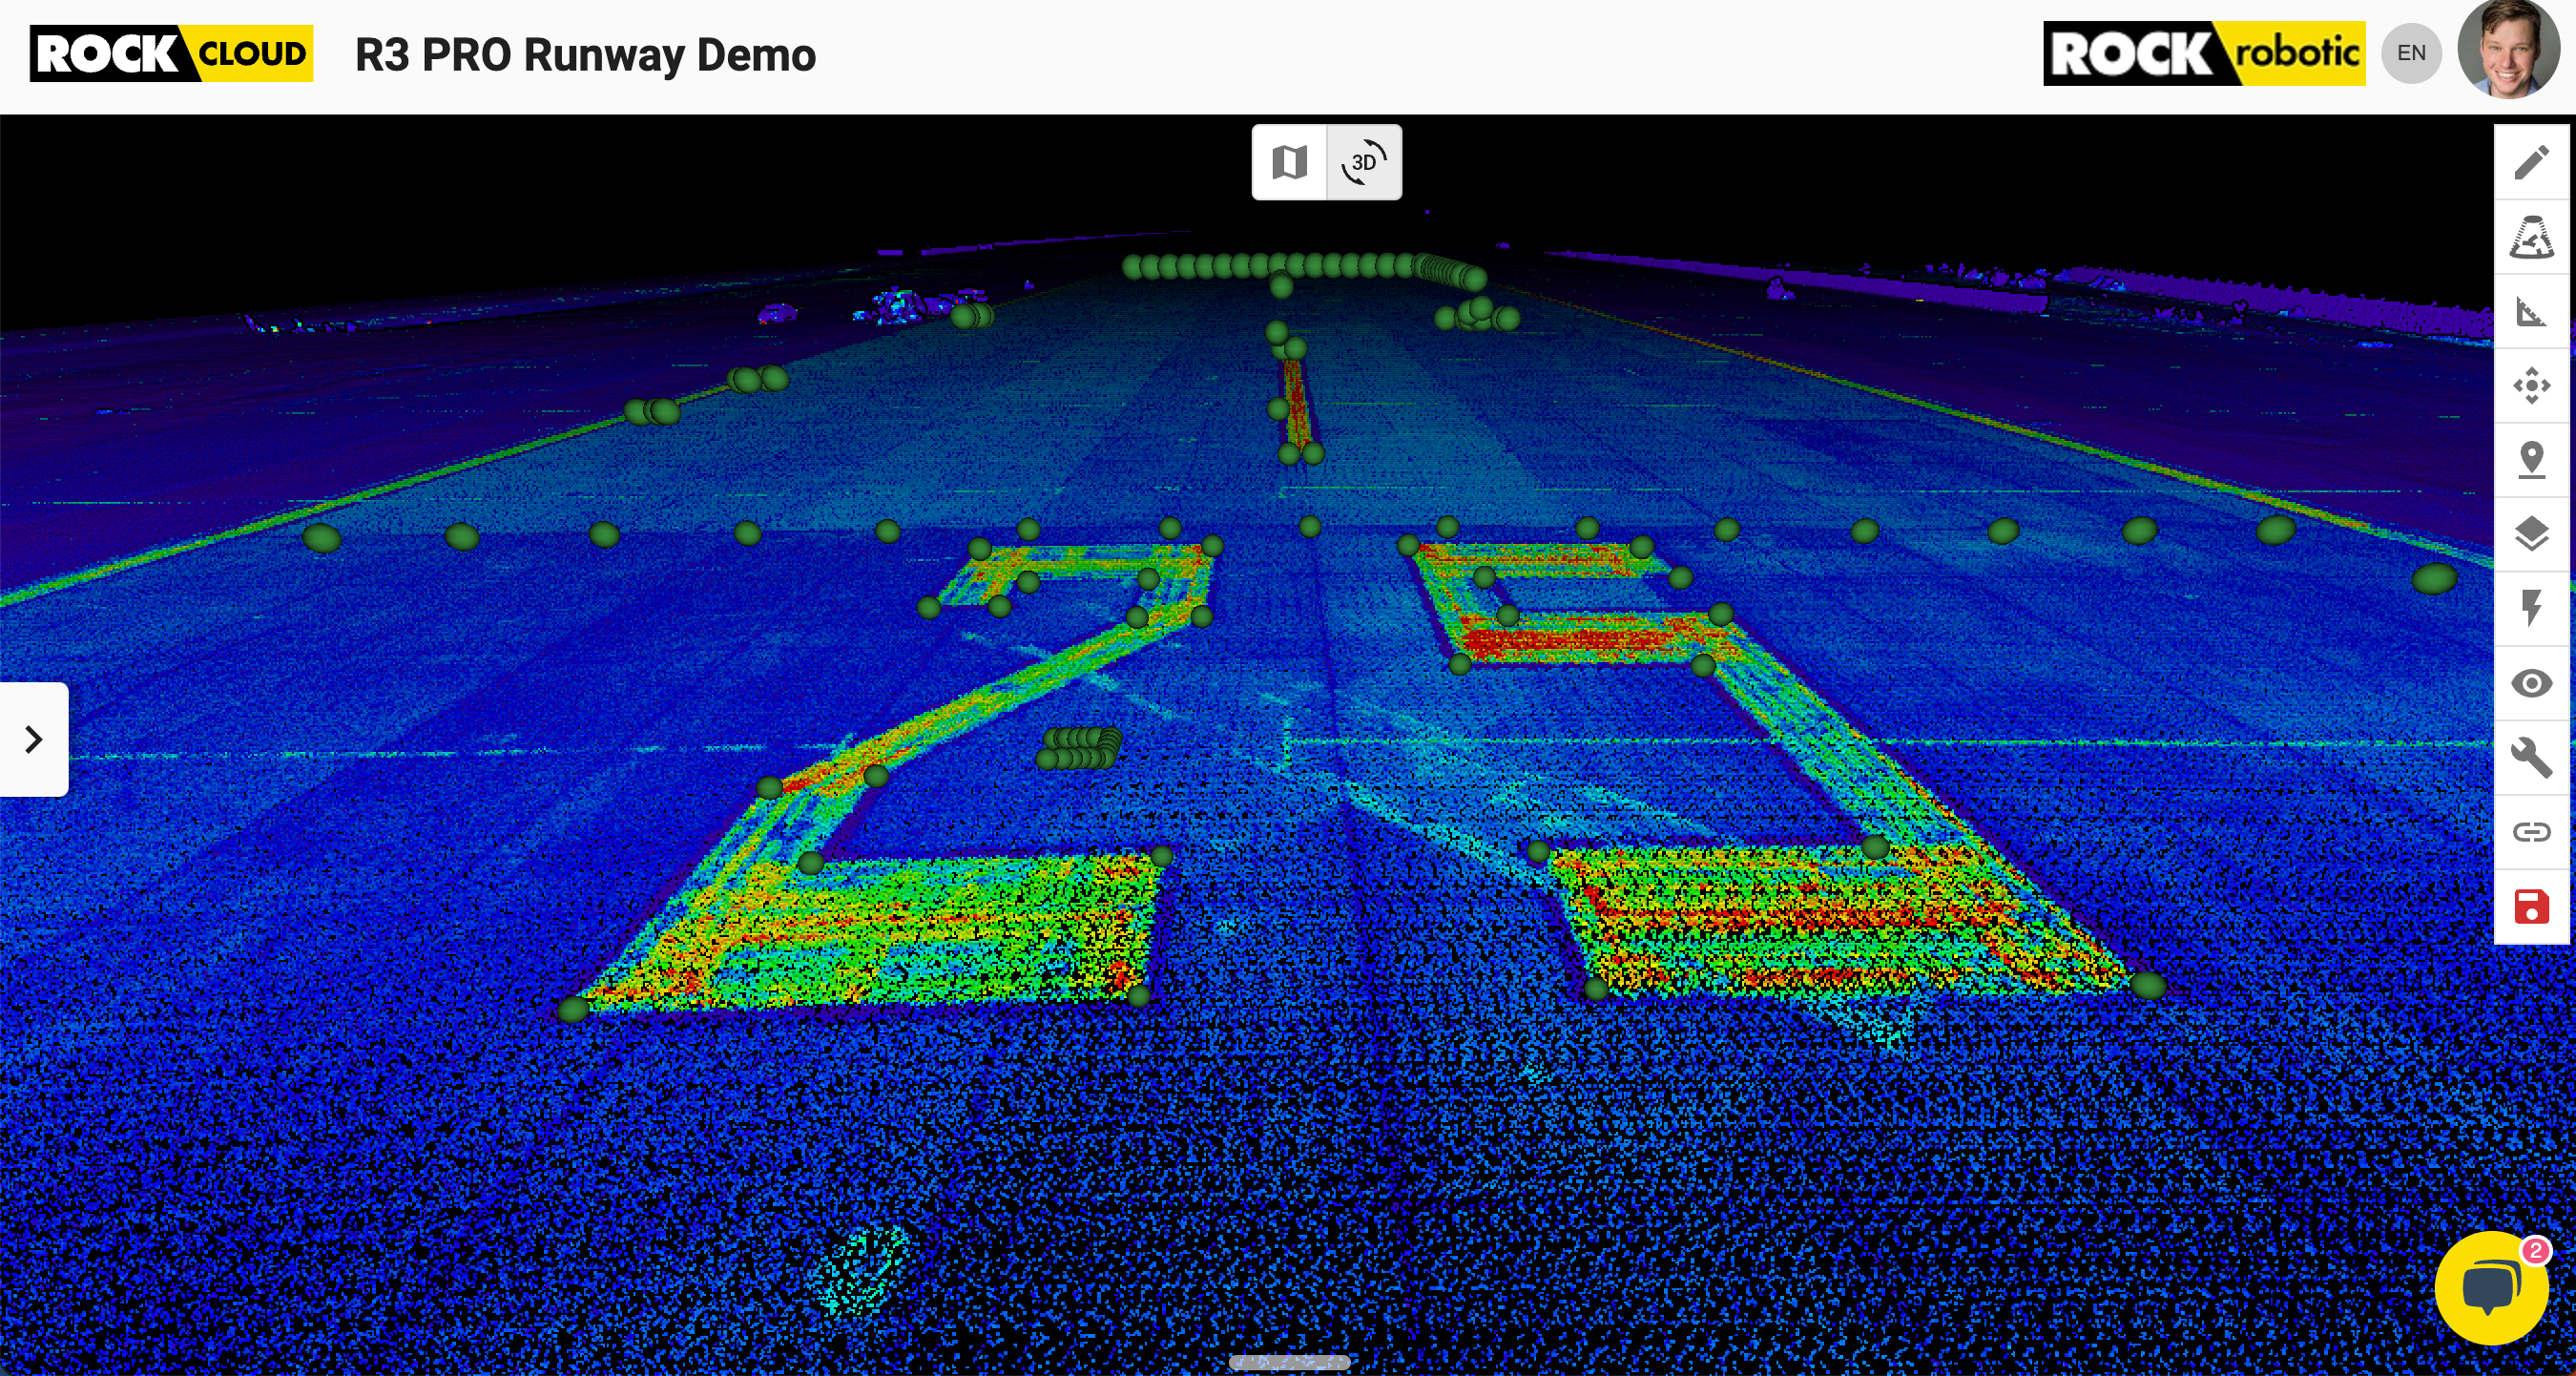
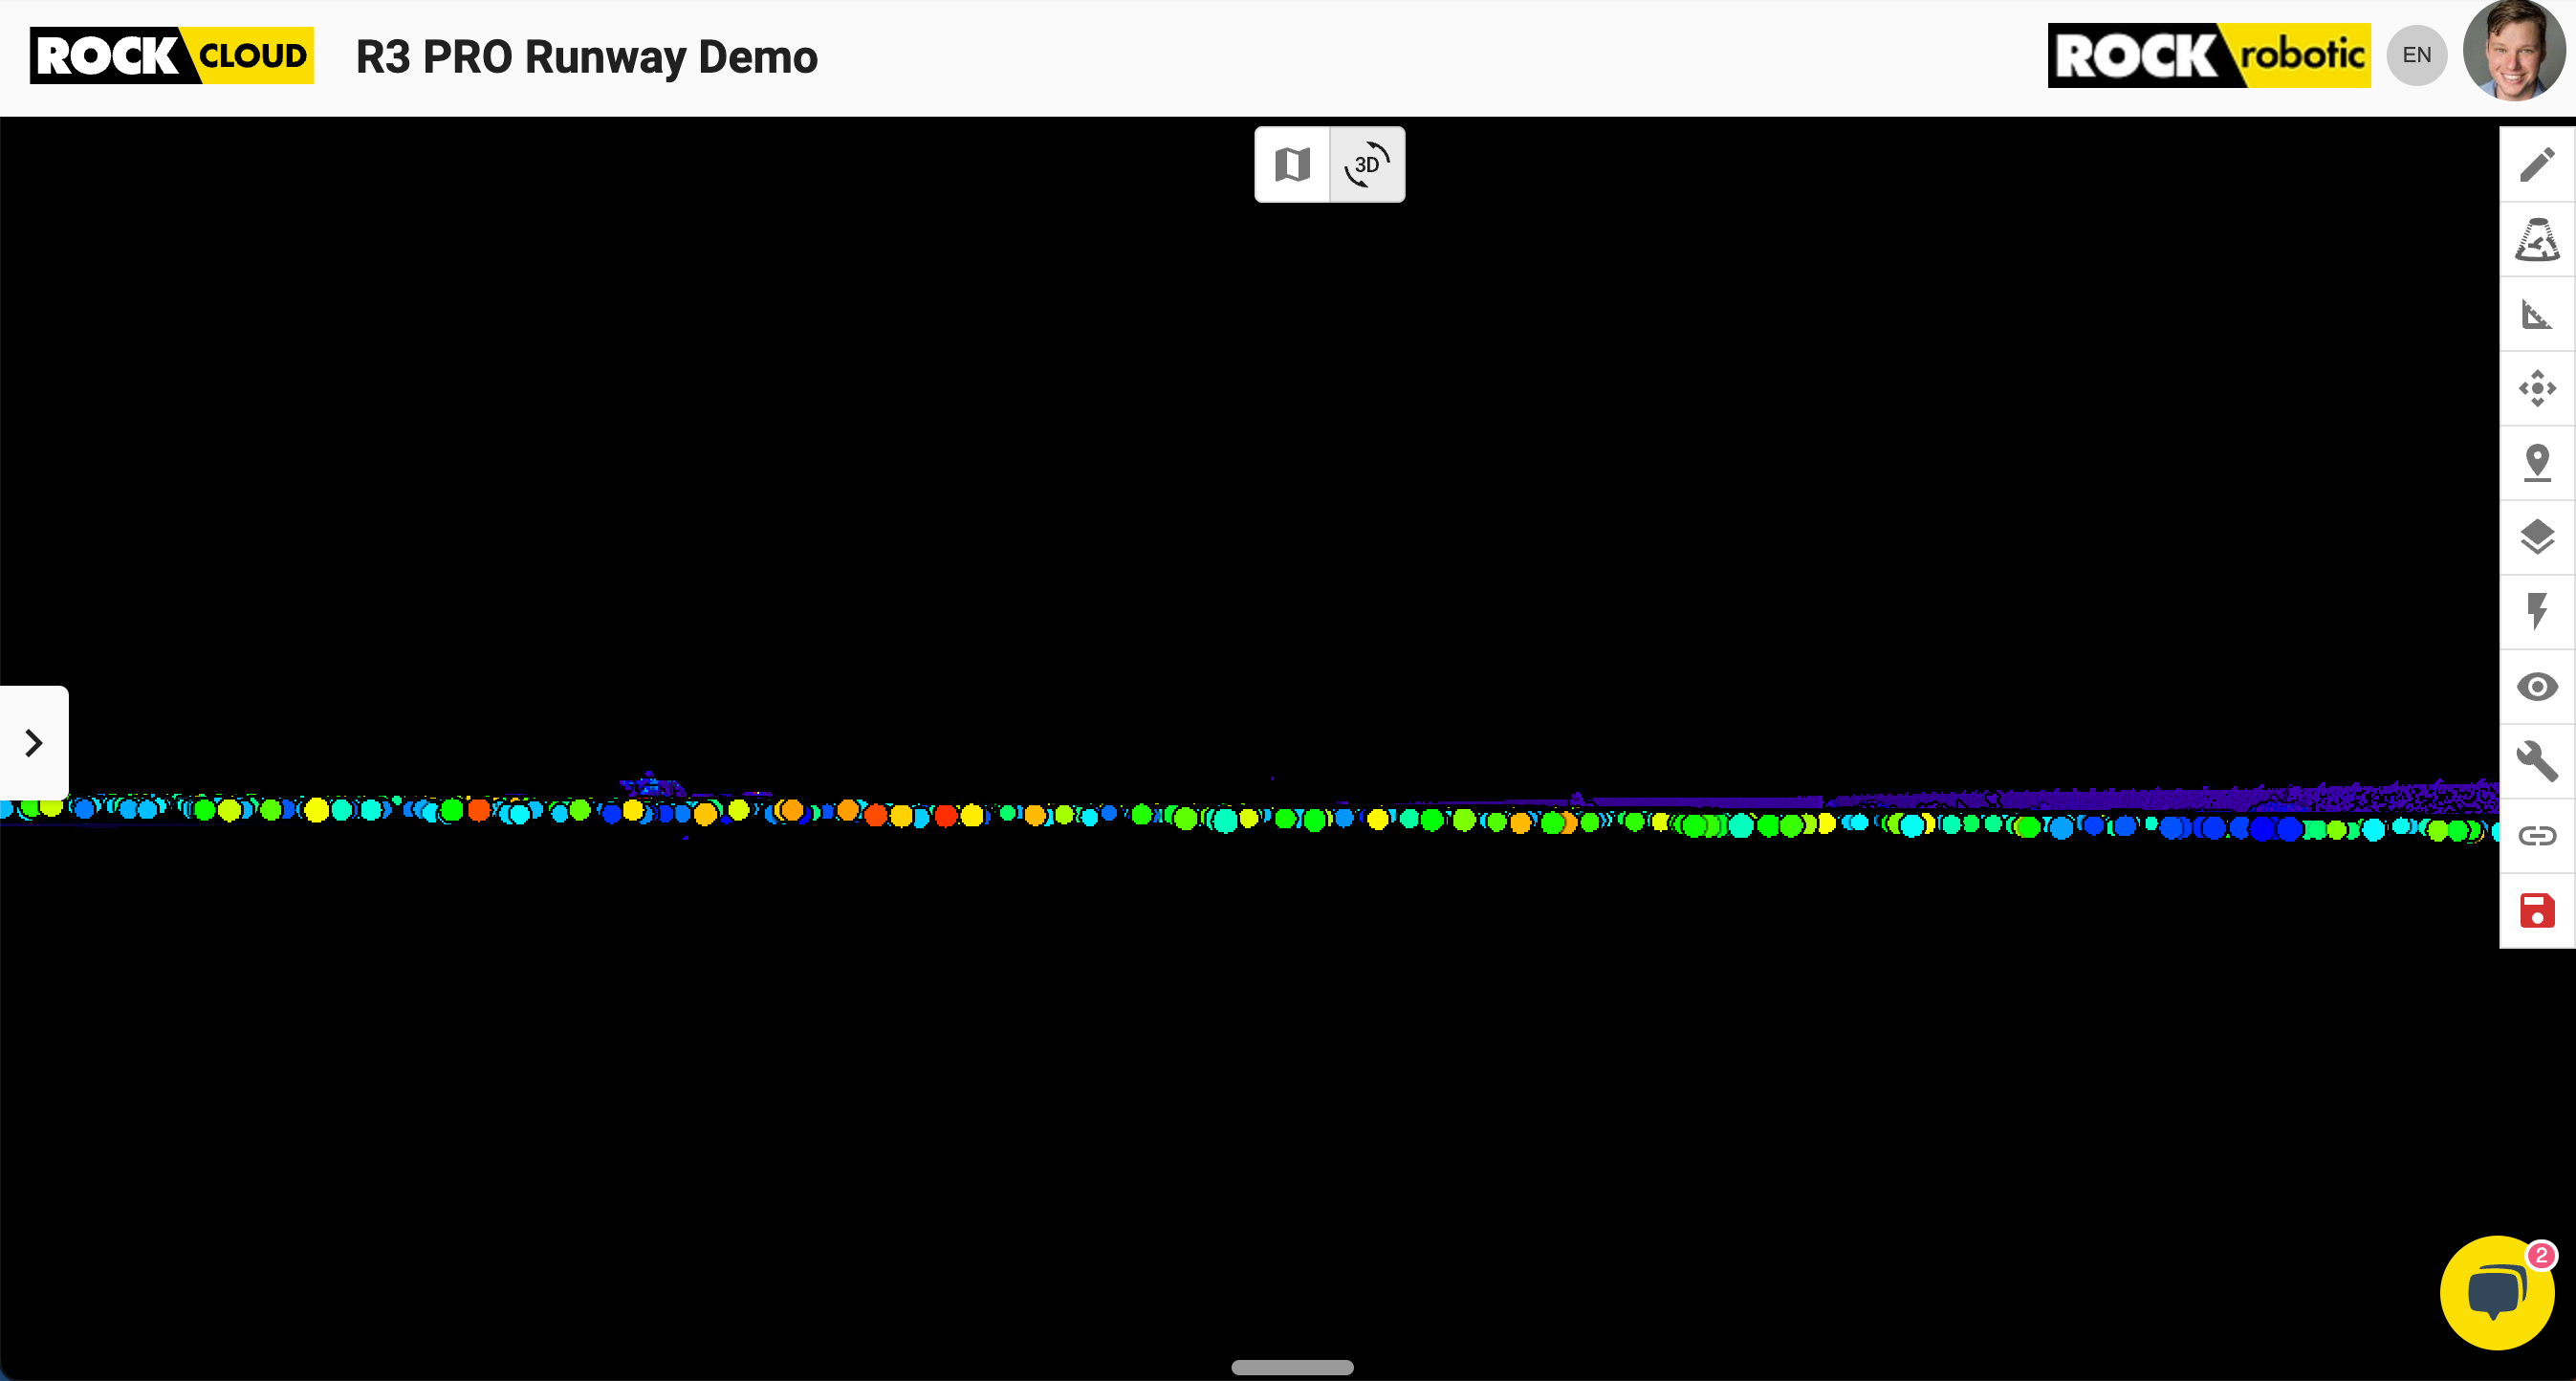
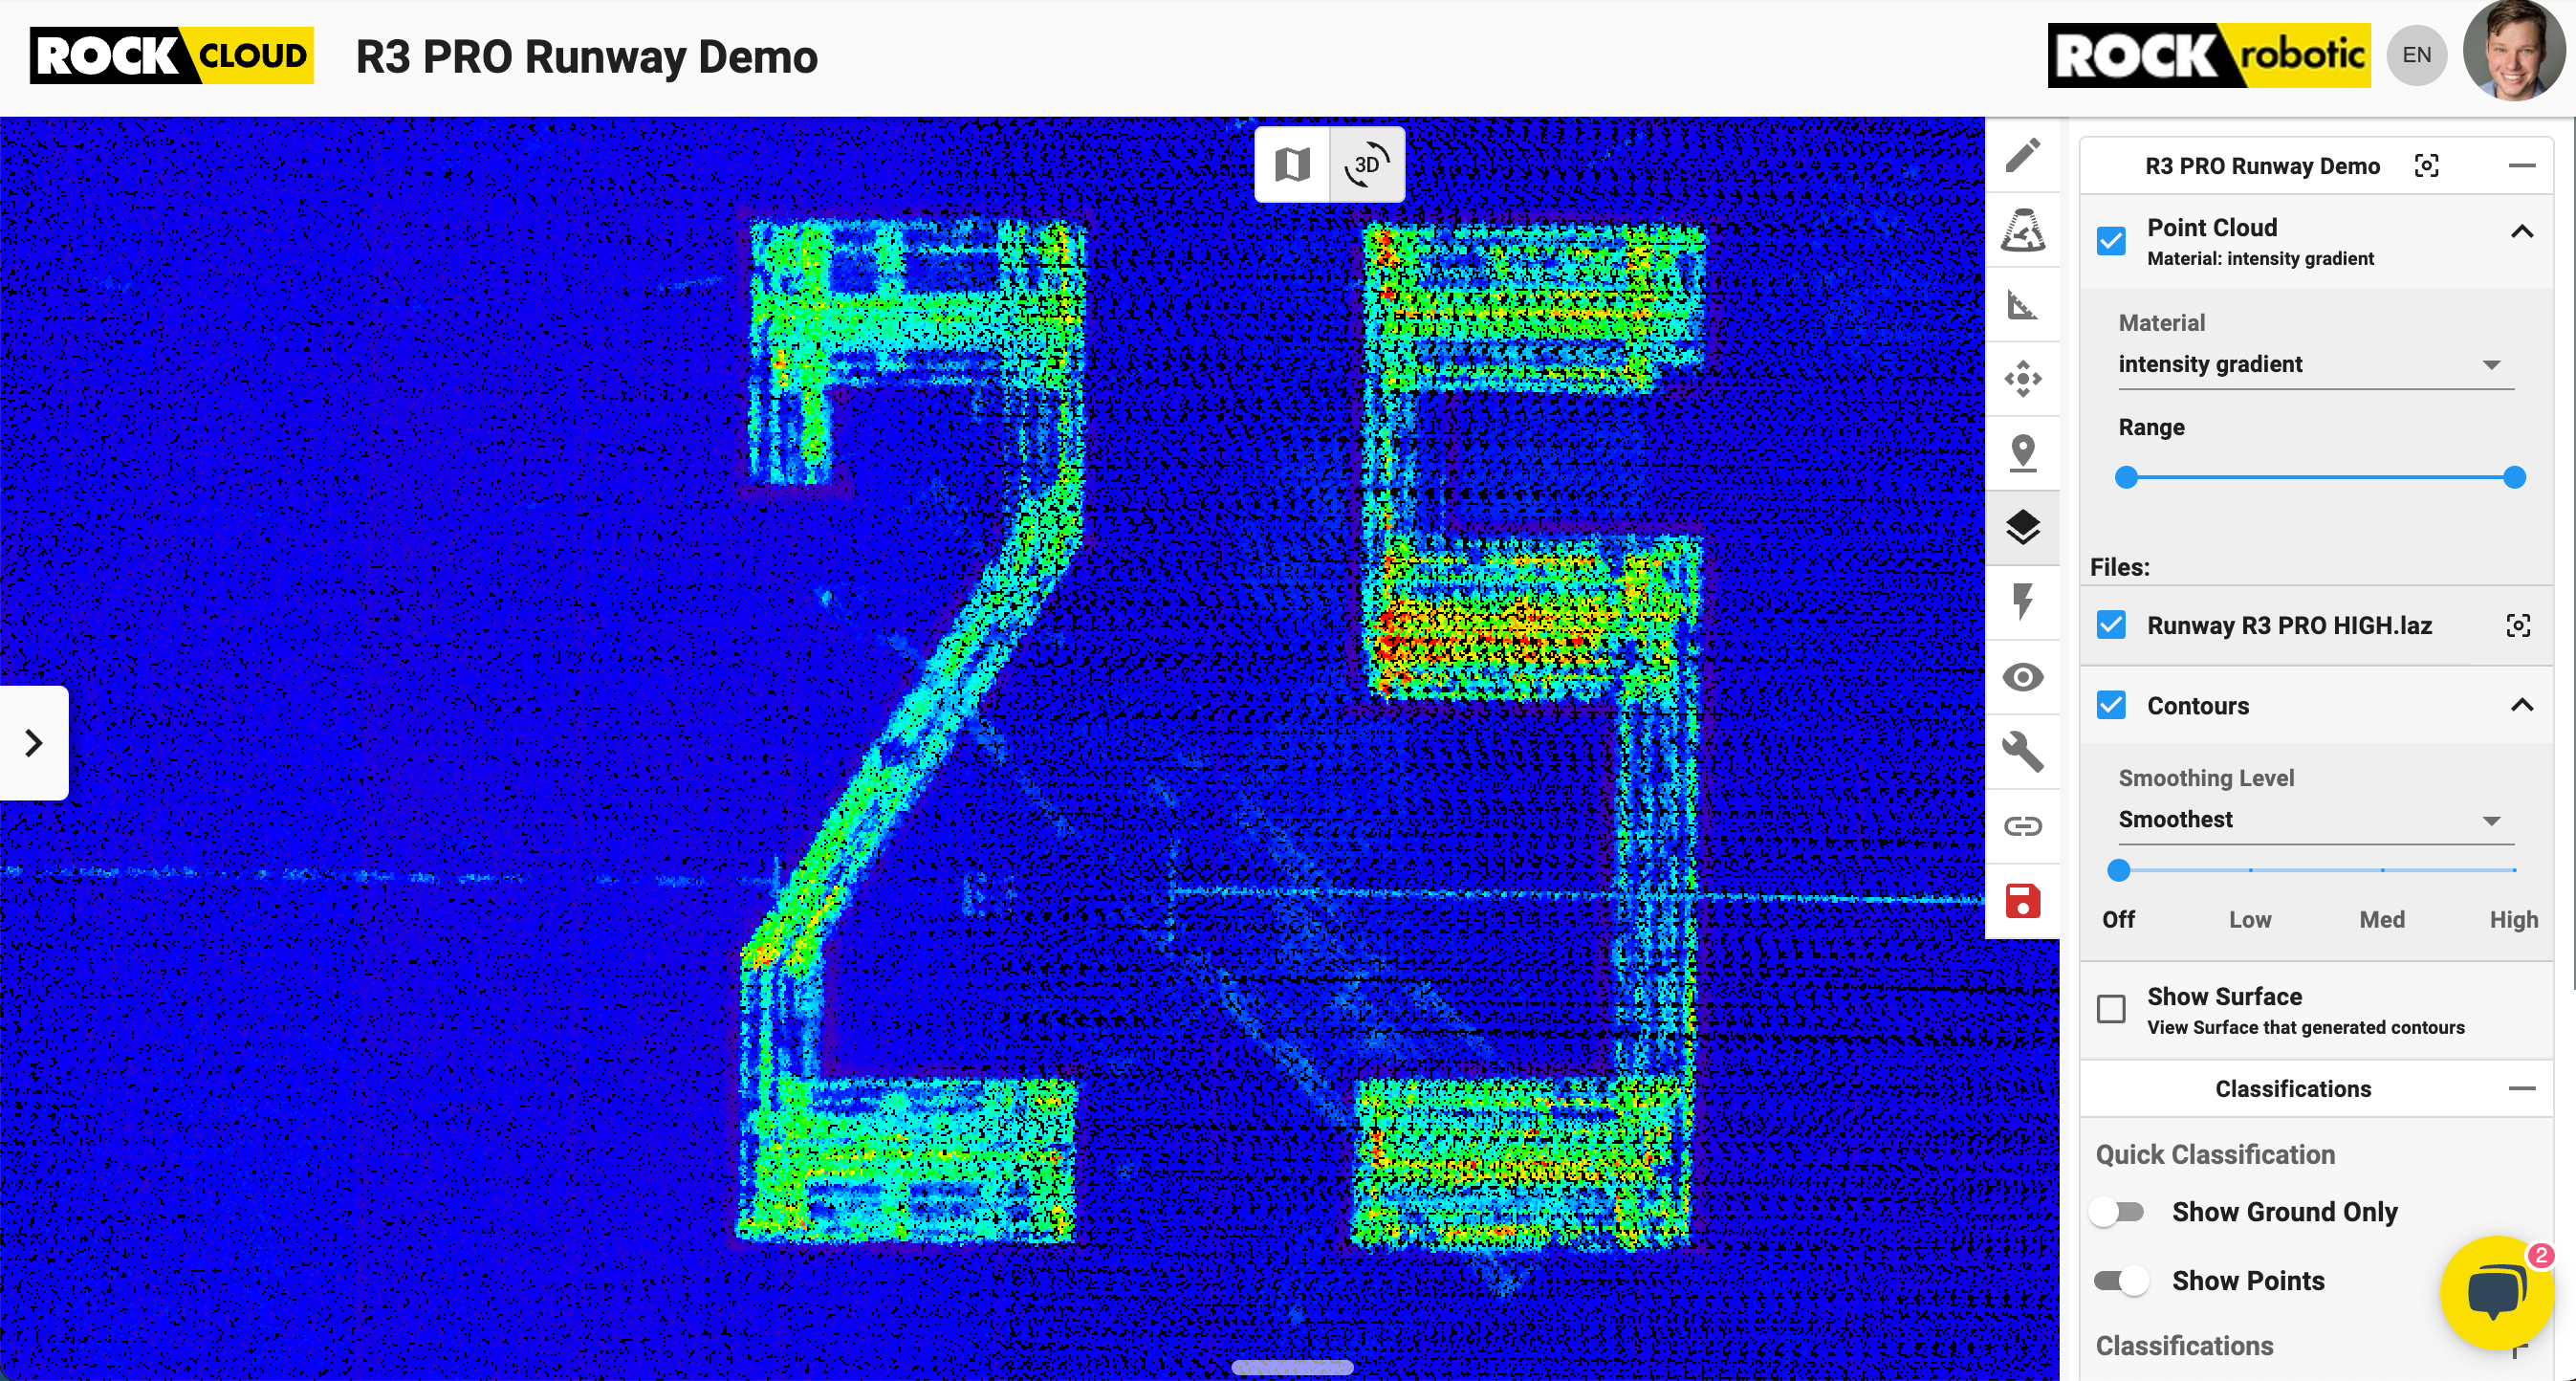
Having gathered the data, it was time to uncover the stories they held. We started by importing the raw point cloud into the ROCK Cloud for processing and analysis. After adding the 178 RTK Check shots we quickly verified the alignment with a visual inspection. This way we can see the features in the intensity view and compare them to the RTK shot.
Accuracy Report: Vertical Precision that Astounds
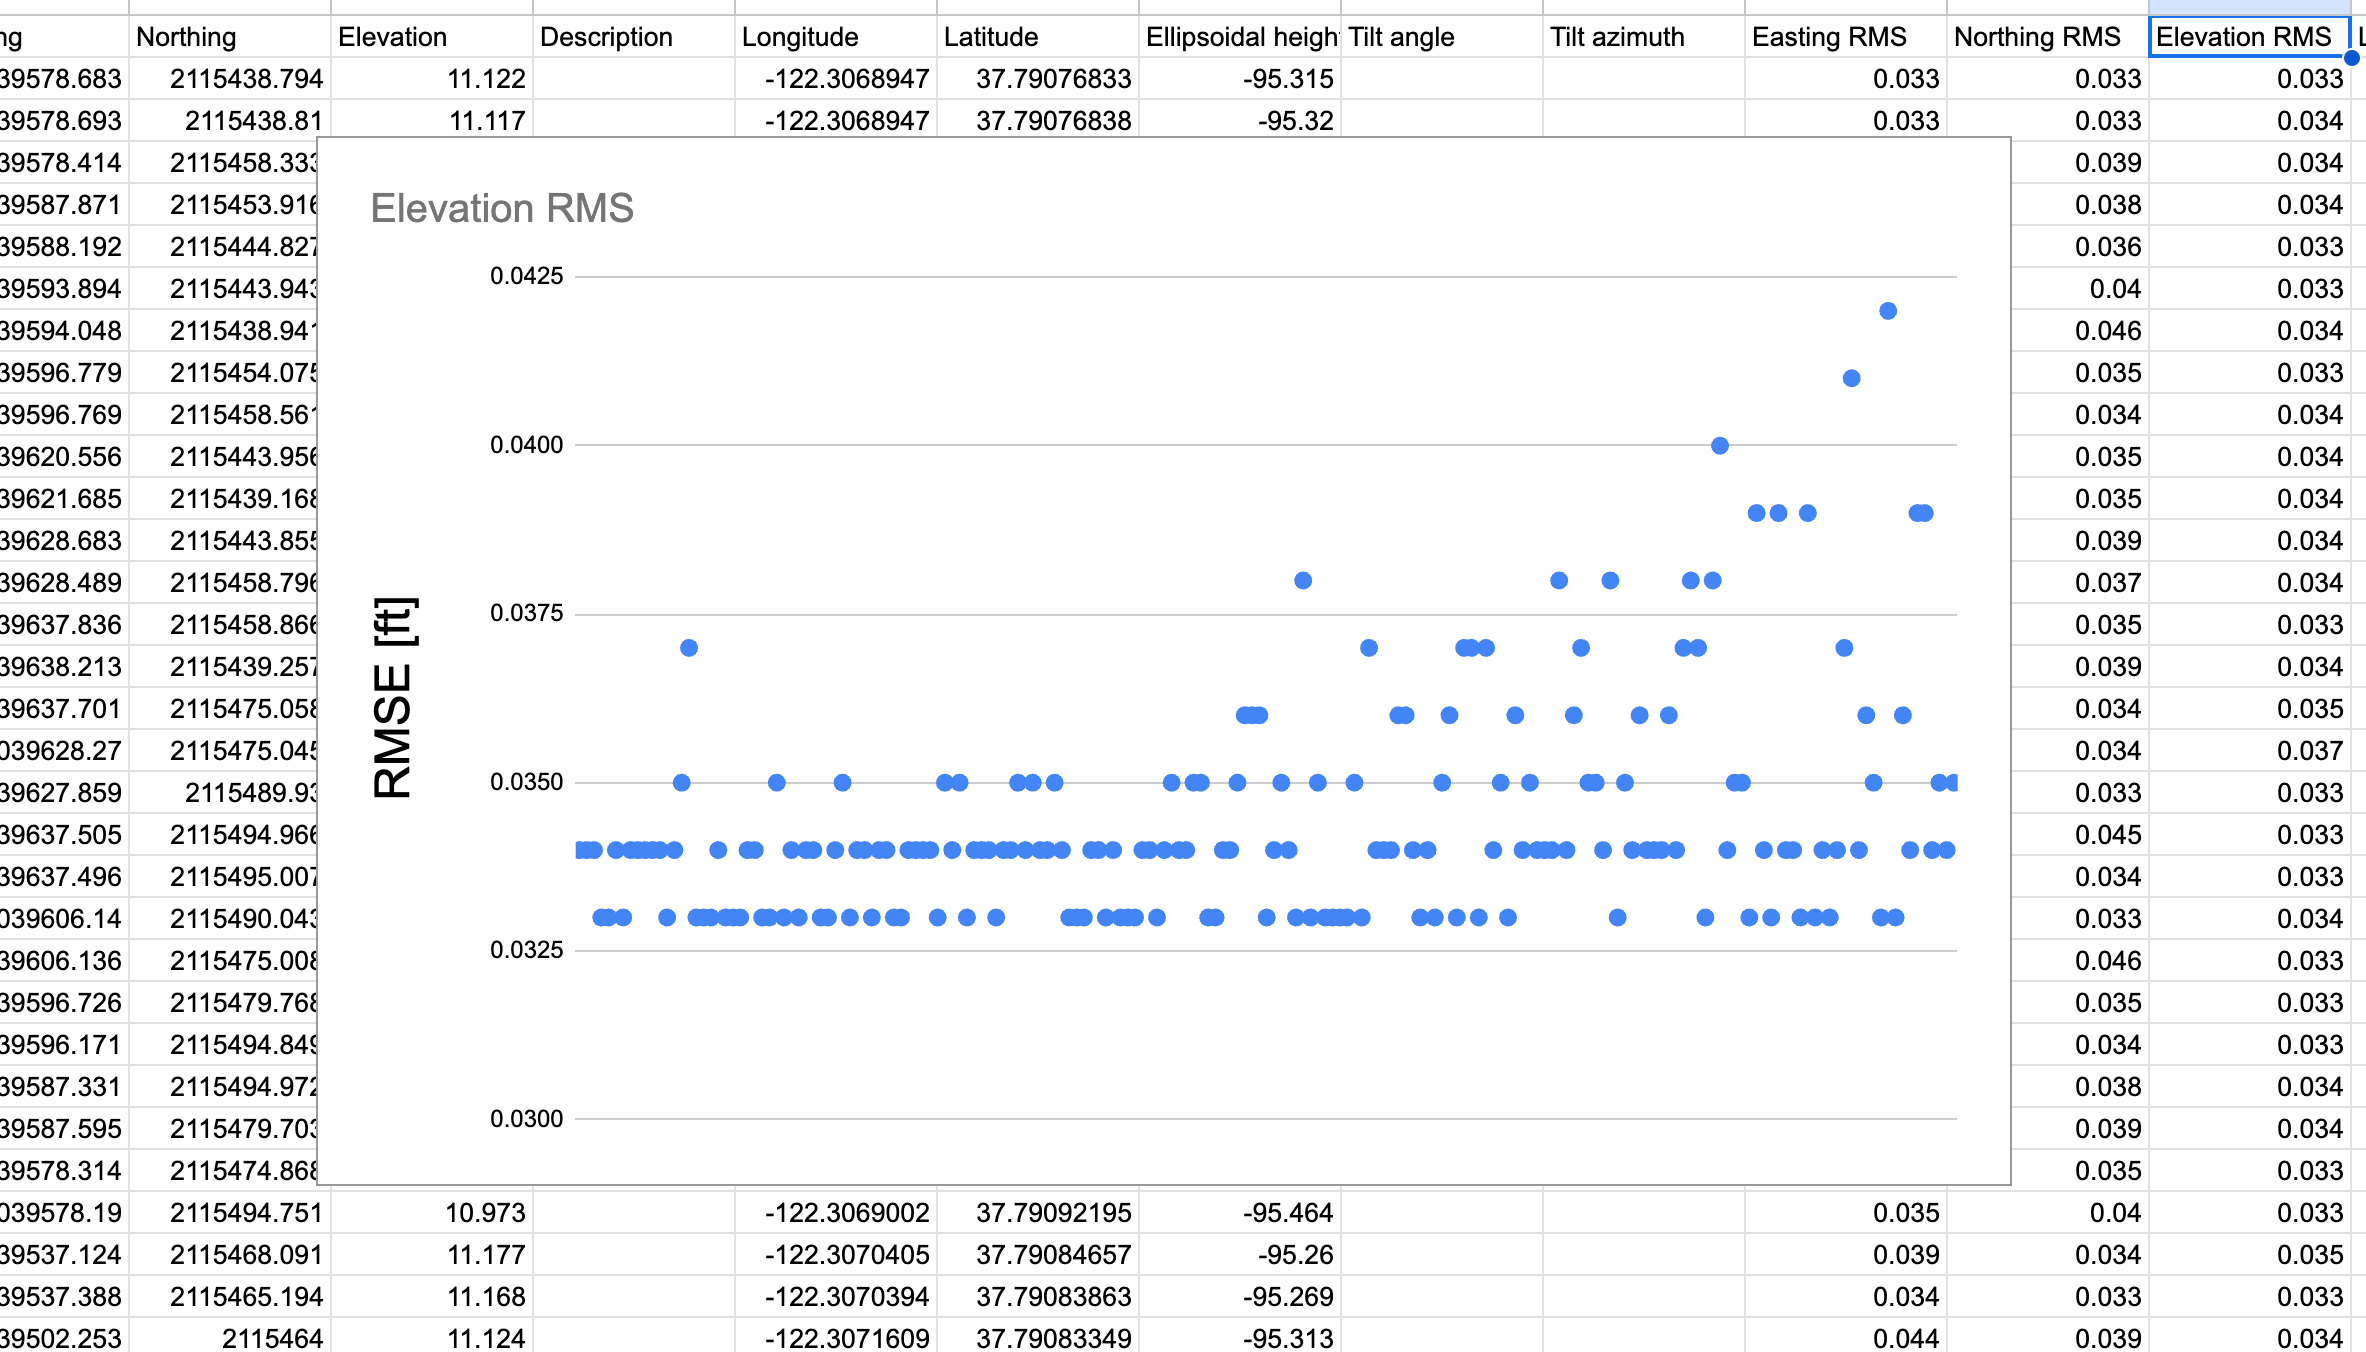
First up was the Accuracy Report. Here, we zeroed in on the vertical accuracies. The image below visualizes the impressive results of this analysis. The statistics are simply staggering!
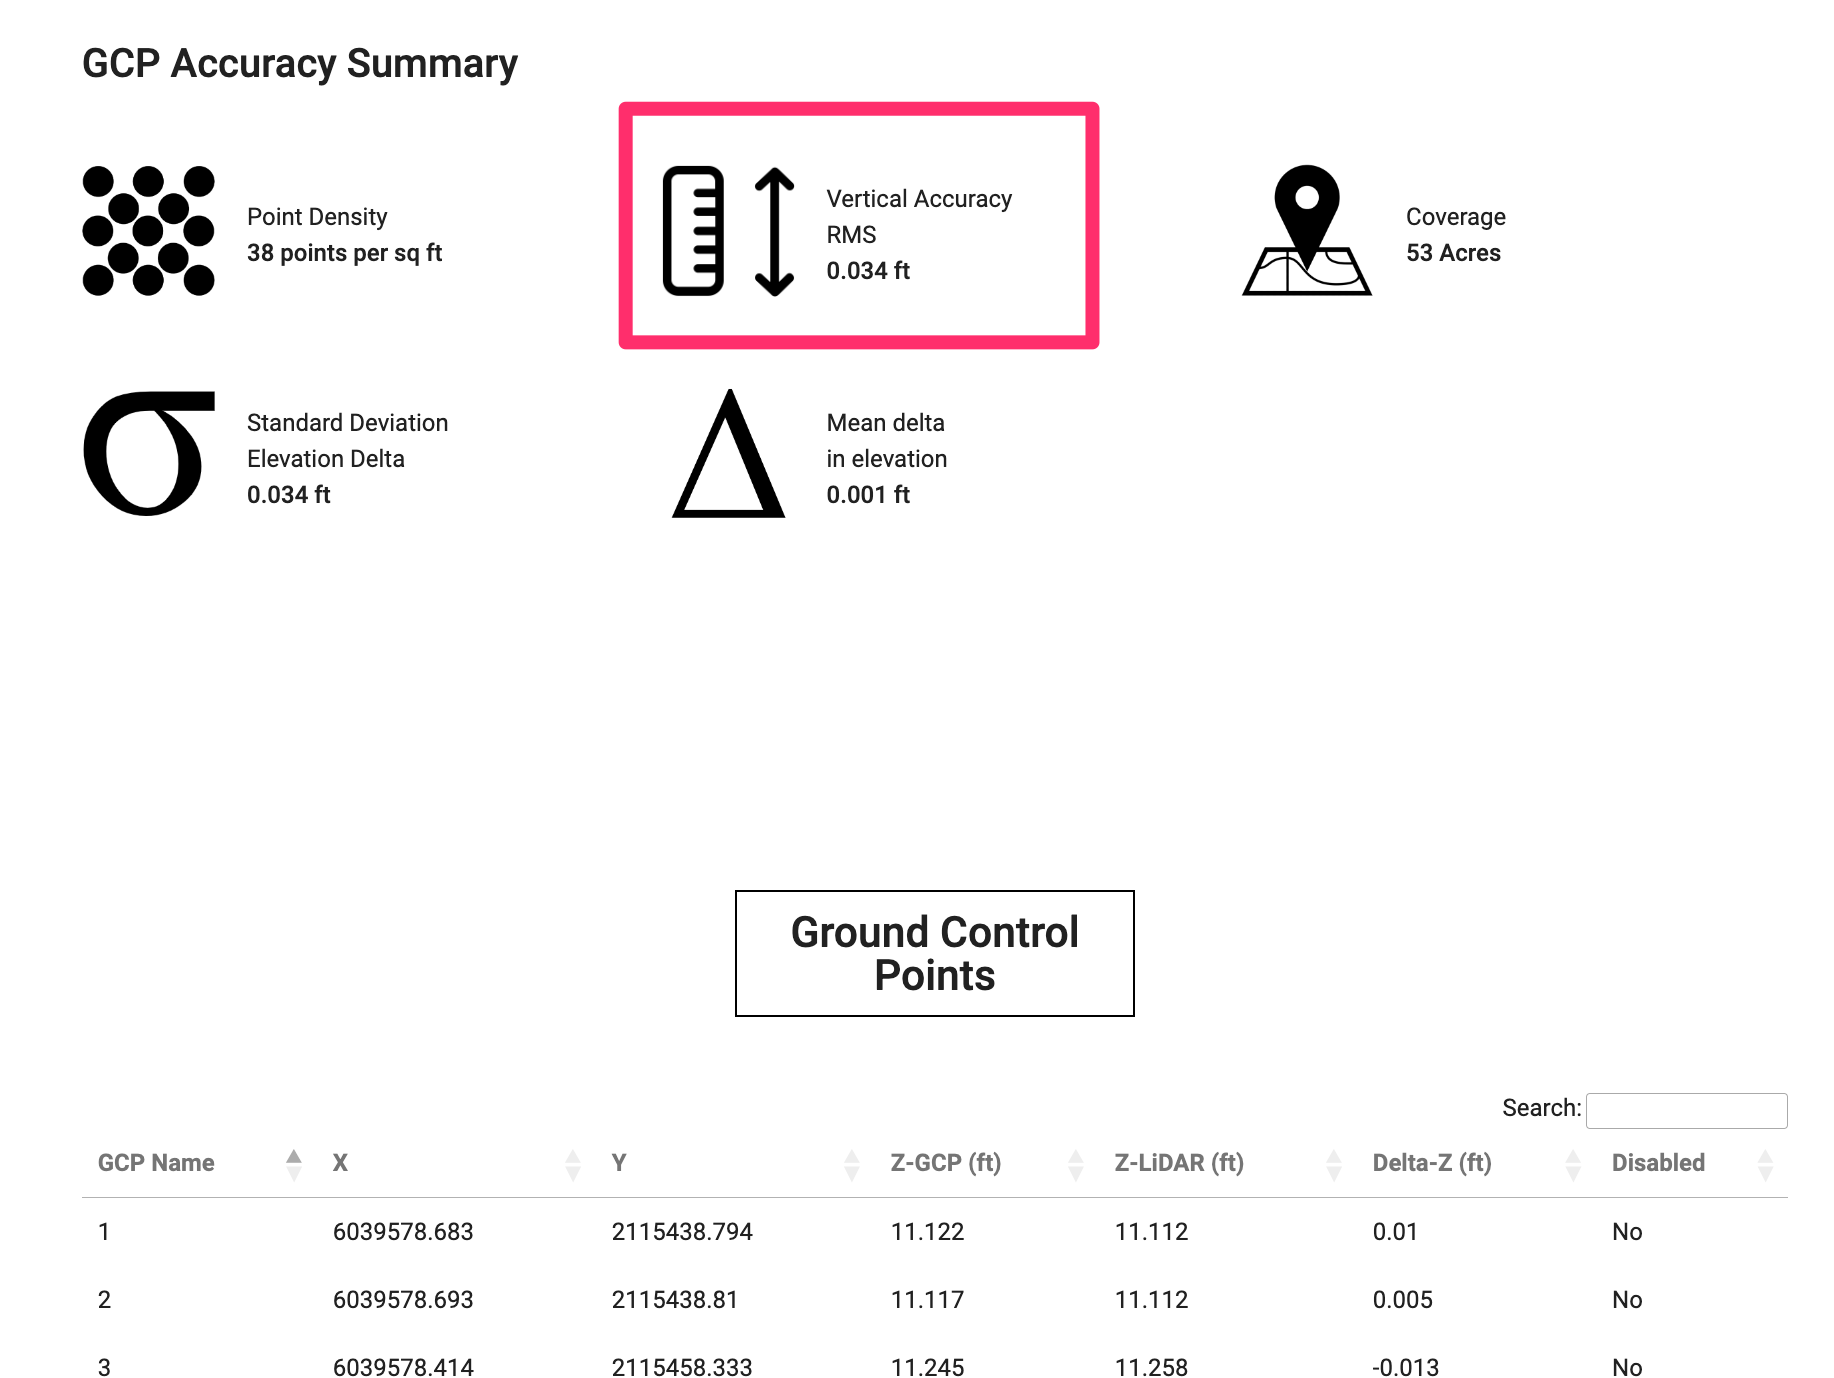
Here's a snapshot of the numbers:
- Point Density: A high-resolution 38 points per sq ft
- Coverage: A sweeping 53 Acres
- Standard Deviation in Elevation Delta: A minimal 0.034 ft
- Mean Delta in Elevation: A near-zero 0.001 ft
However, the absolute showstopper here is the Vertical Accuracy (RMS), which came out to be a staggering 0.034 ft! Yes, our eyes popped too! This figure is a striking testament to the unparalleled accuracy and reliability of the ROCK R3 Pro, with an incredibly low variance between the LiDAR data and the RTK check shots.
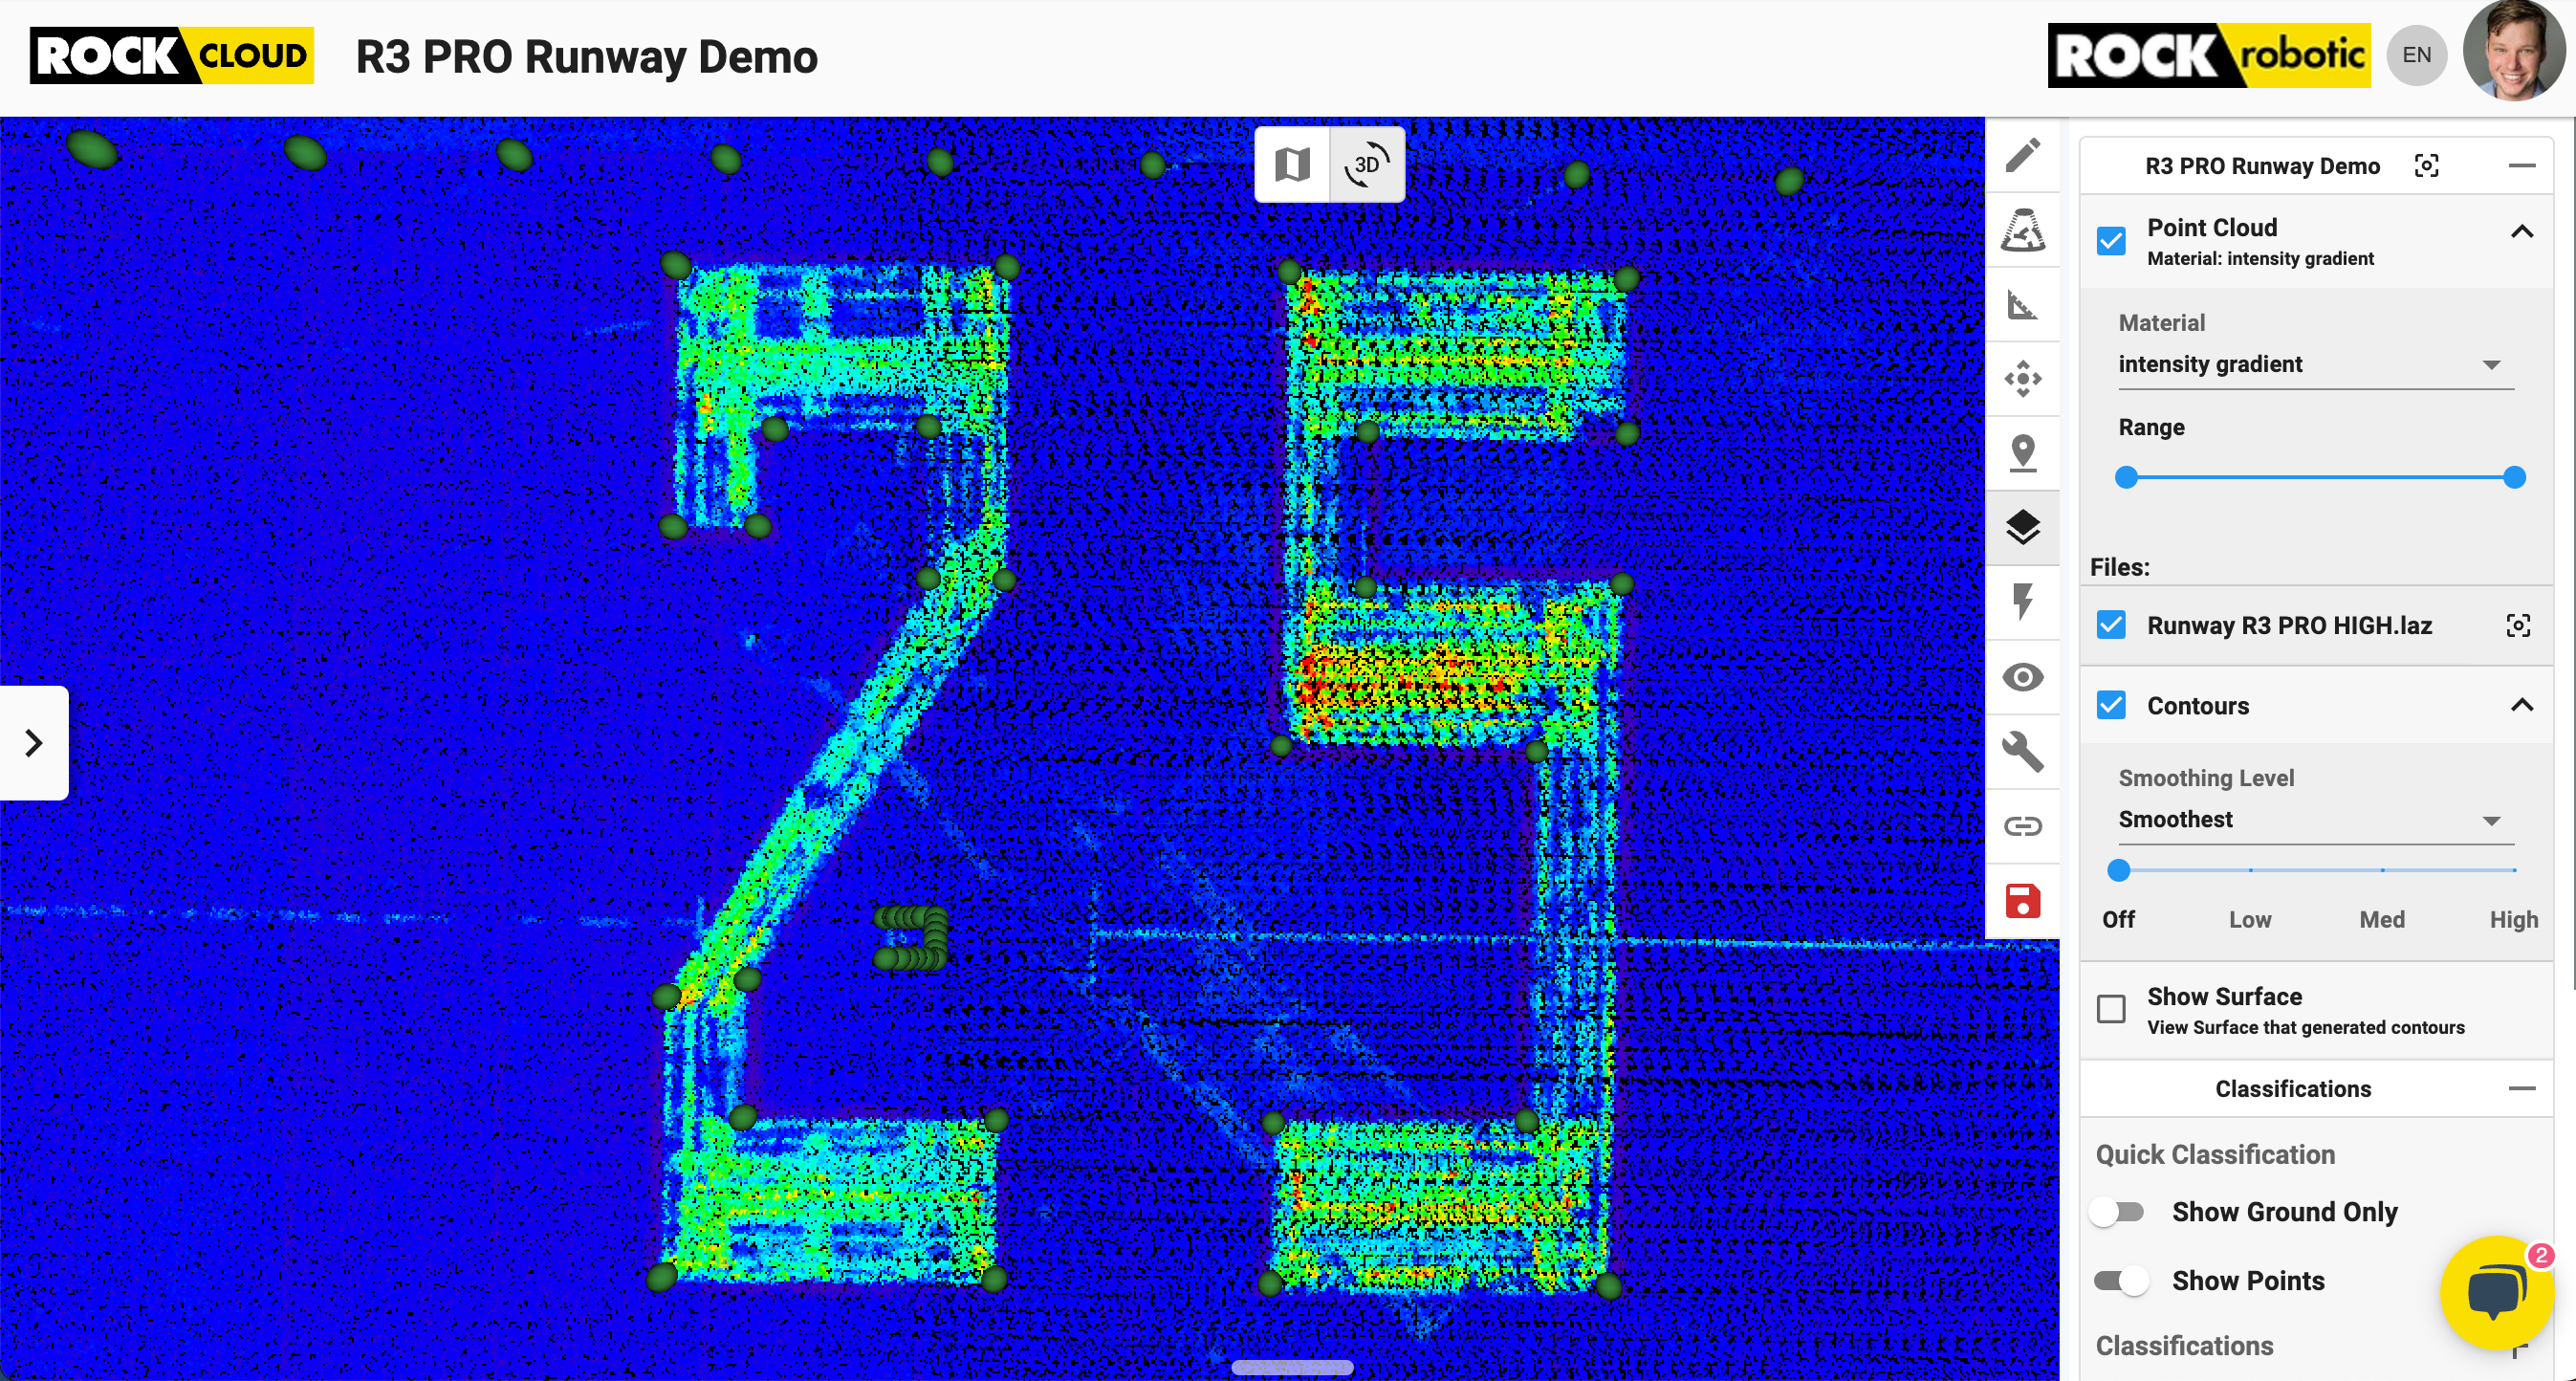
I mean, just take a look at how consistent the data from the R3 Pro looks just the the naked eye. The quality is, dare I say, as good as a terrestrial scanner on a tripod!
Strip Alignment: The Age of LiDAR 2.0
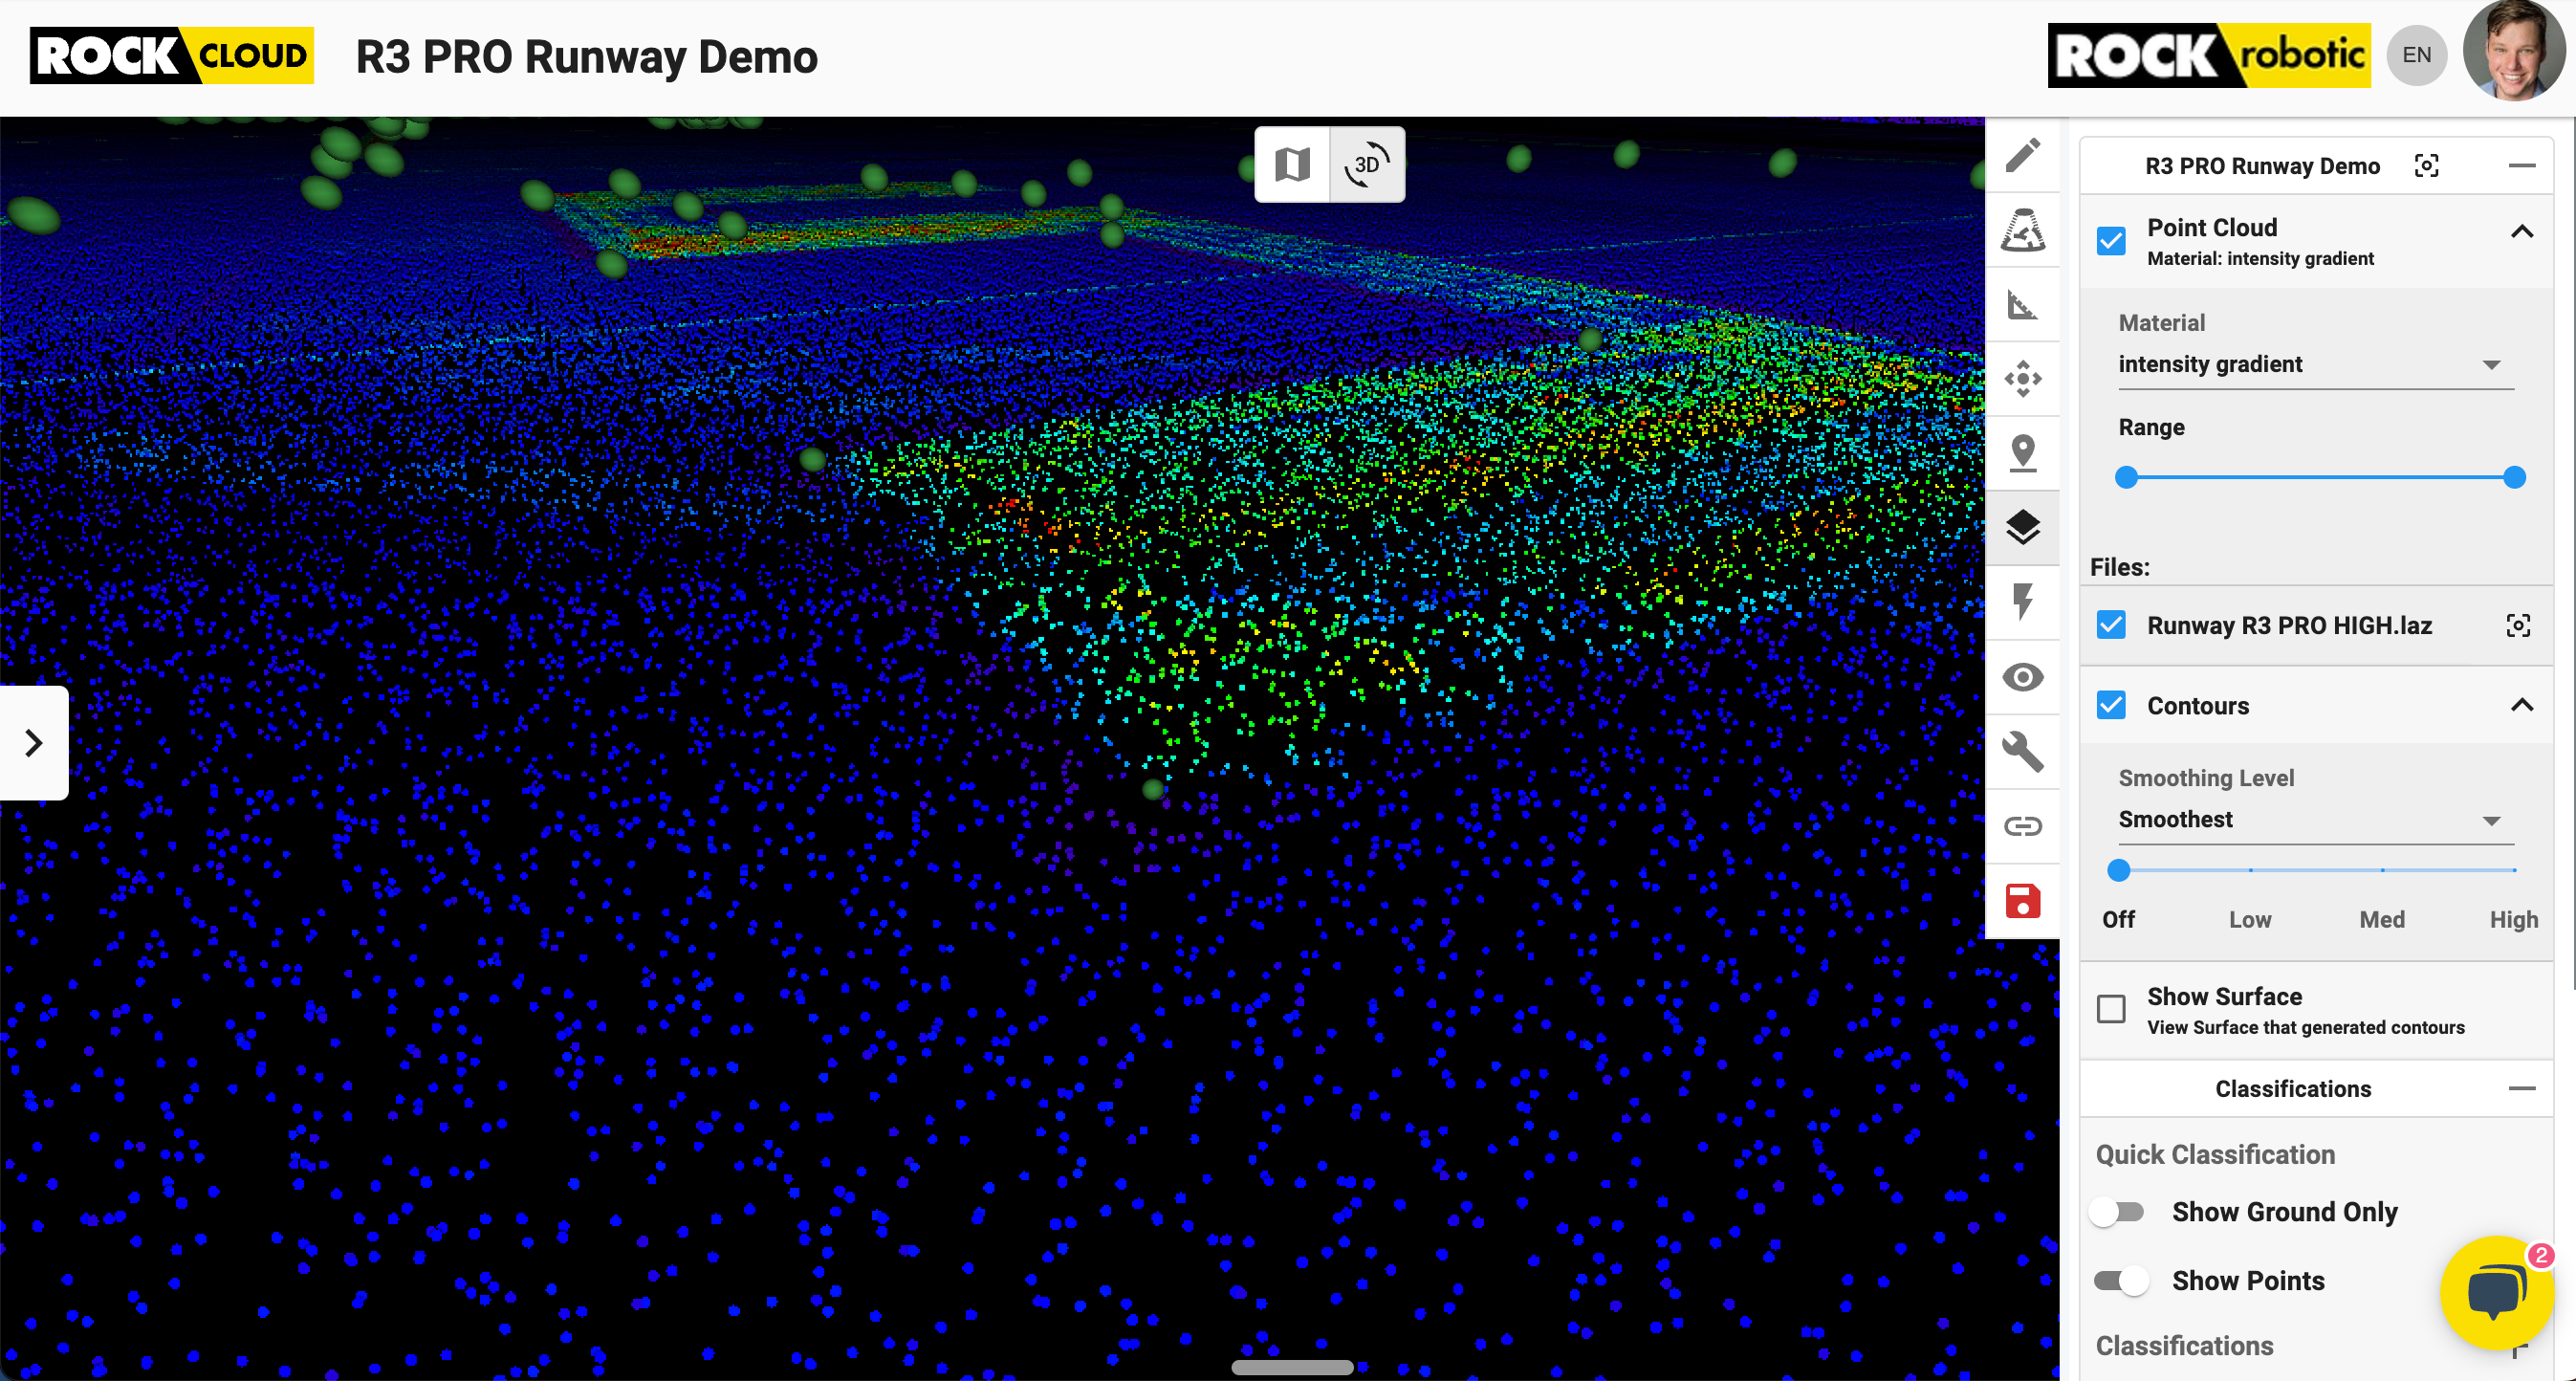
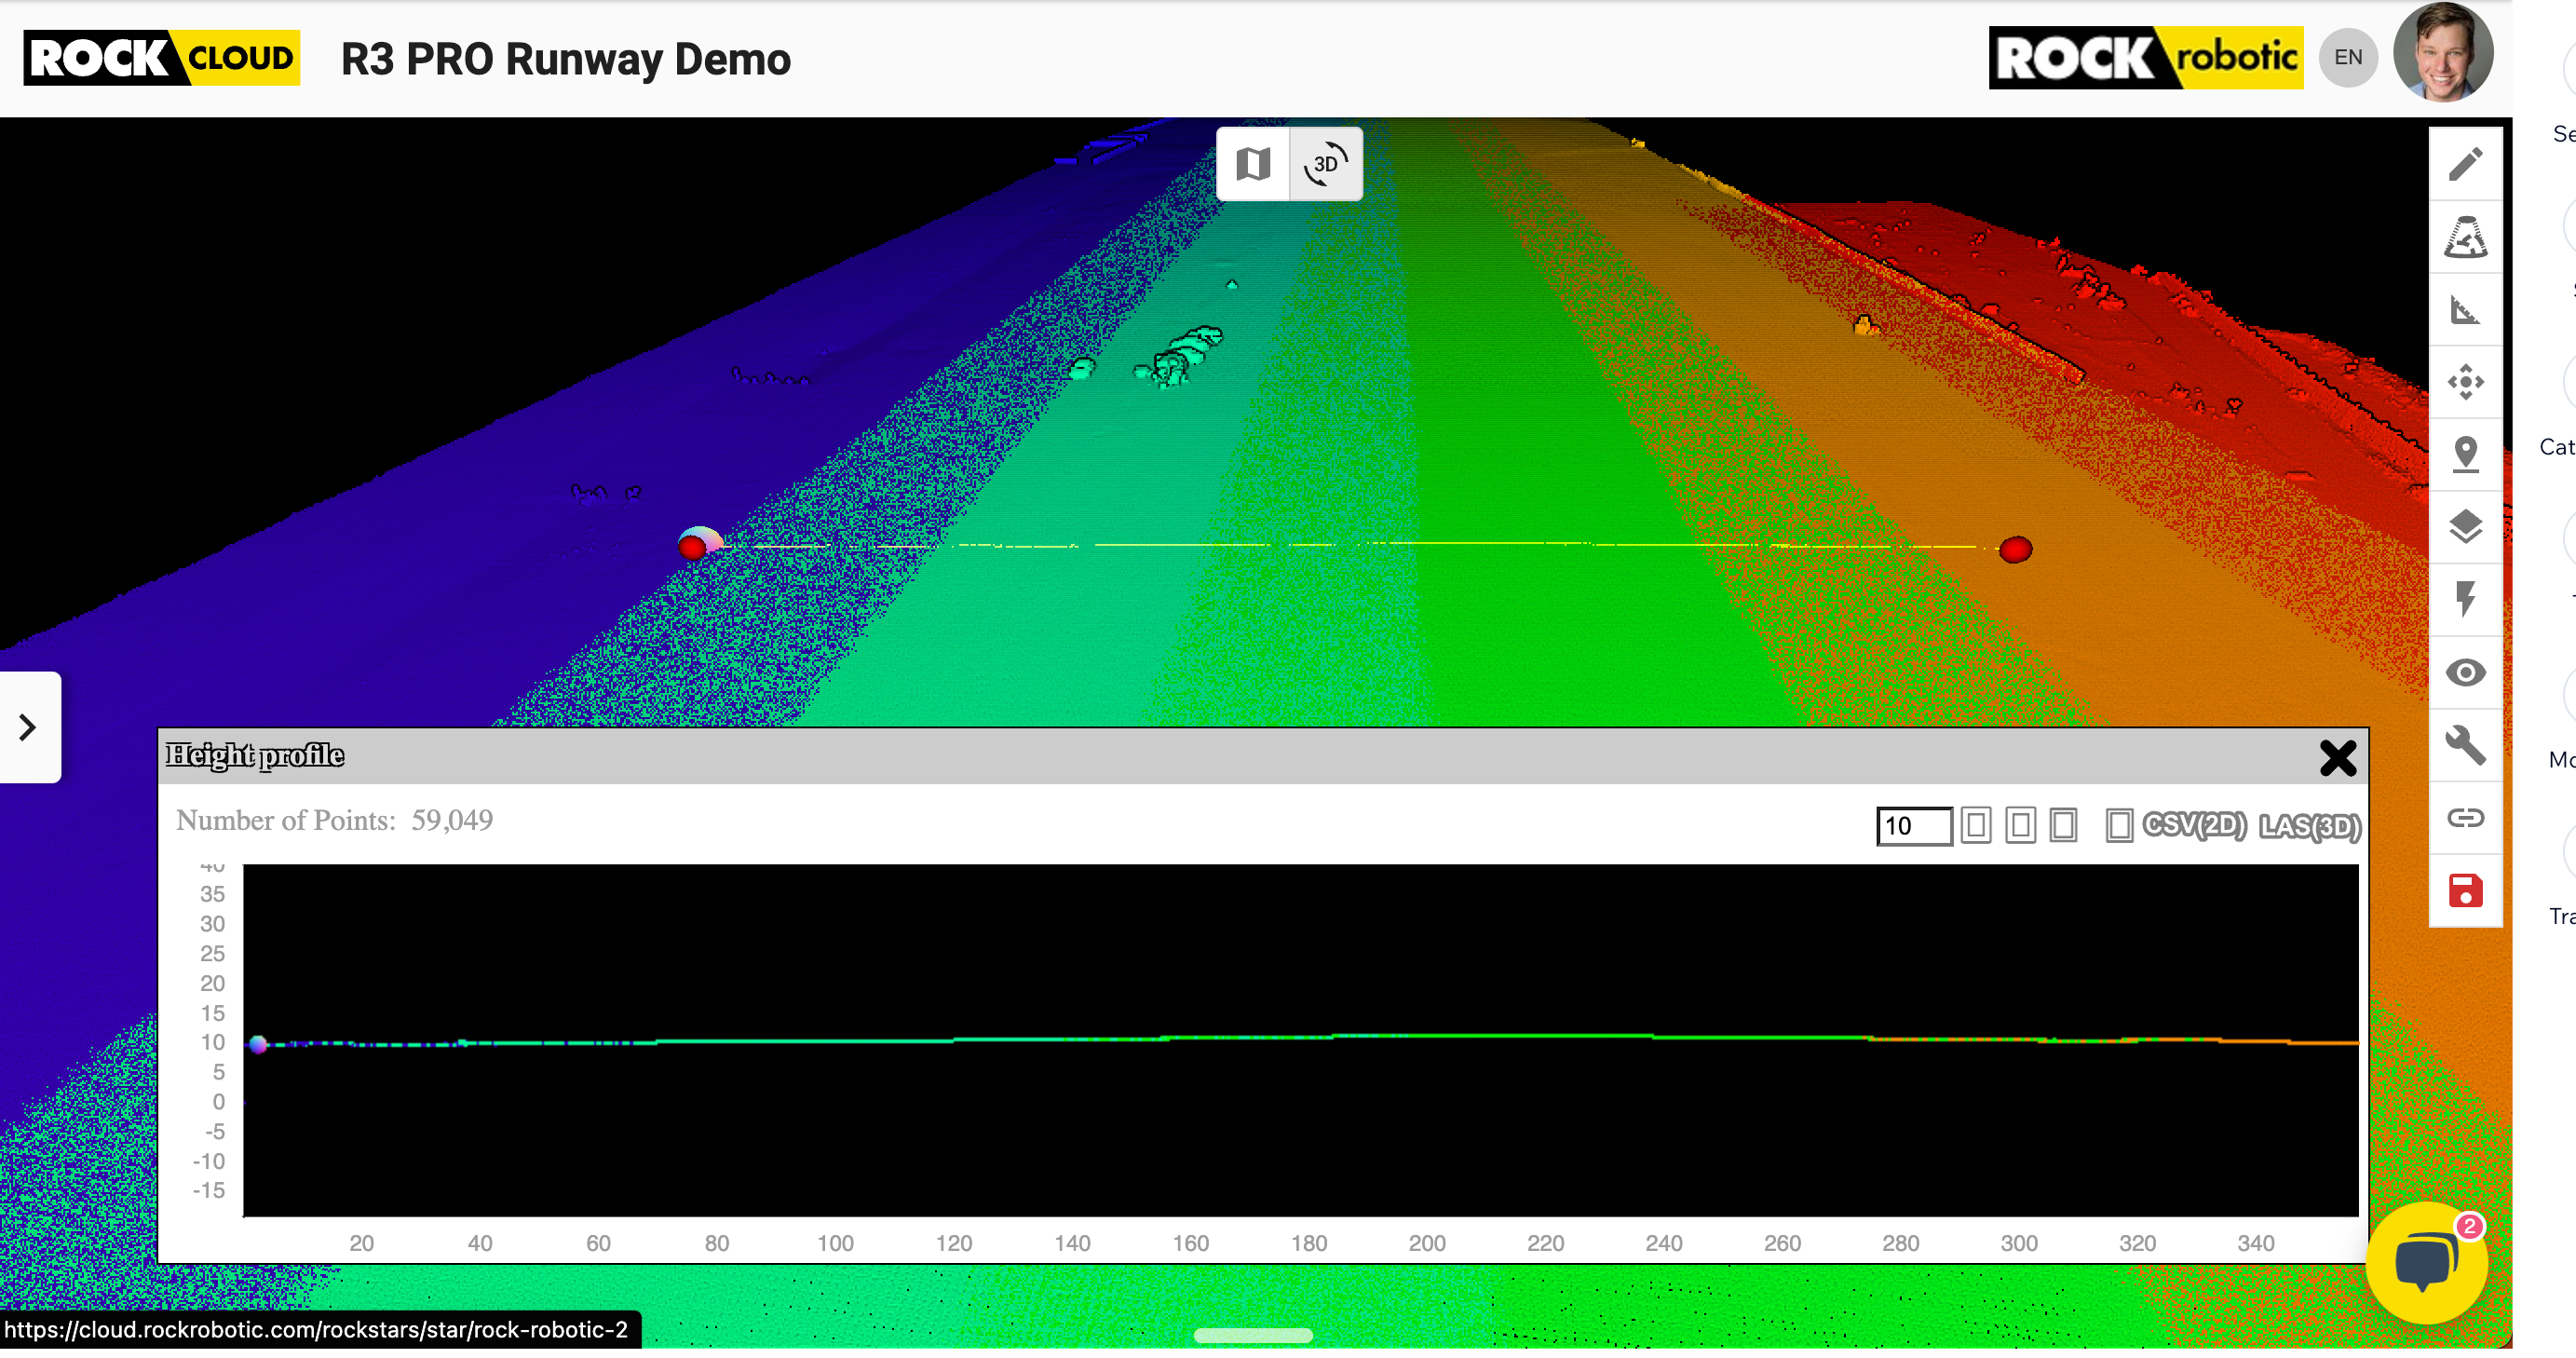
Next up was Strip Alignment. In the previous era of LiDAR 1.0, strip alignment was a tedious manual process plagued with errors and inconsistencies. But welcome to LiDAR 2.0, courtesy of ROCK Robotic! With our cutting-edge system, strip alignment issues are virtually non-existent. Below, I change the view into GPS time so we can easily visualize the individual flight strips that were captured. I draw a cross-section profile and the data is perfectly aligned. This should be expected as a default standard on all ROCK hardware.
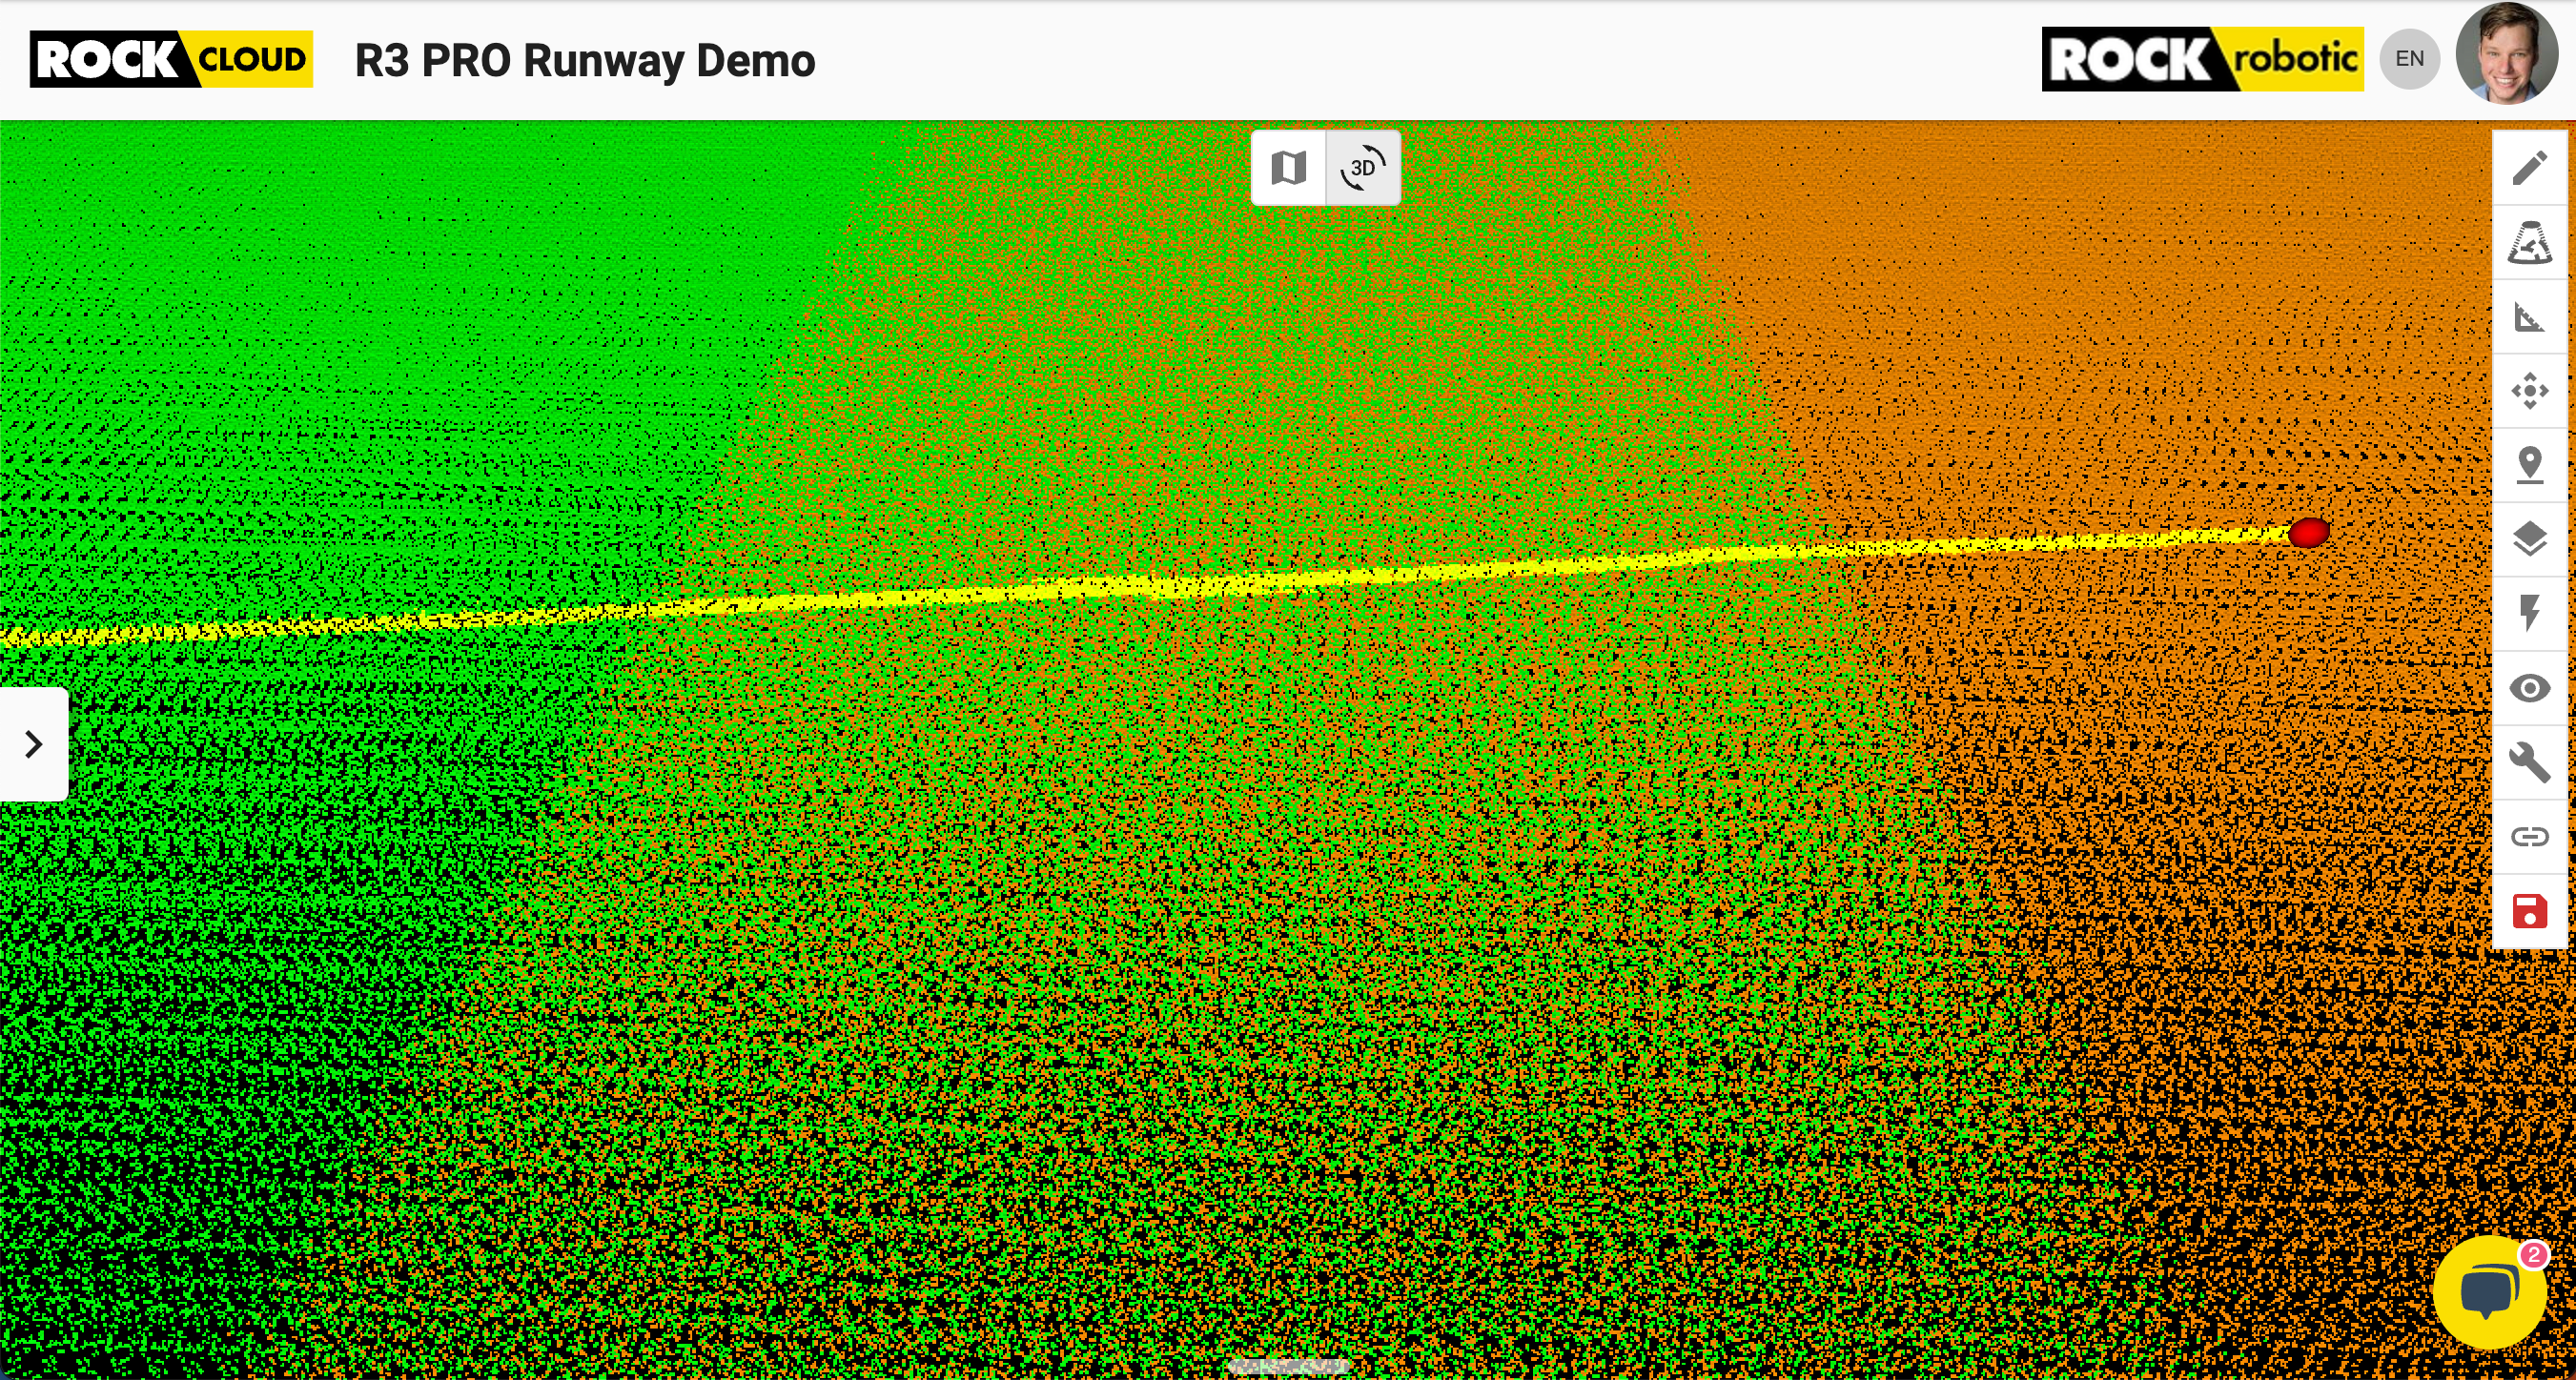
To further highlight this point, take a look at the second photo and look at the mixture of colors. This is a real, back of the envelope way to assess the alignment of the data. Here we can clearly see an even mixture of colors, implying that one strip is neither above or below the other. ✅
RGB Camera and LiDAR: A Perfectly Synced Duo
Let's talk about the co-alignment of the RGB camera and the LiDAR laser scanner. In previous generation hardware, these could suffer misalignments. But not with ROCK R3 Pro! Take a look at the perfect camera to LiDAR alignment. By switching between the intensity view (derived from the LiDAR laser scanner) and the RGB view (from the separate camera), we observed a near-perfect overlap.
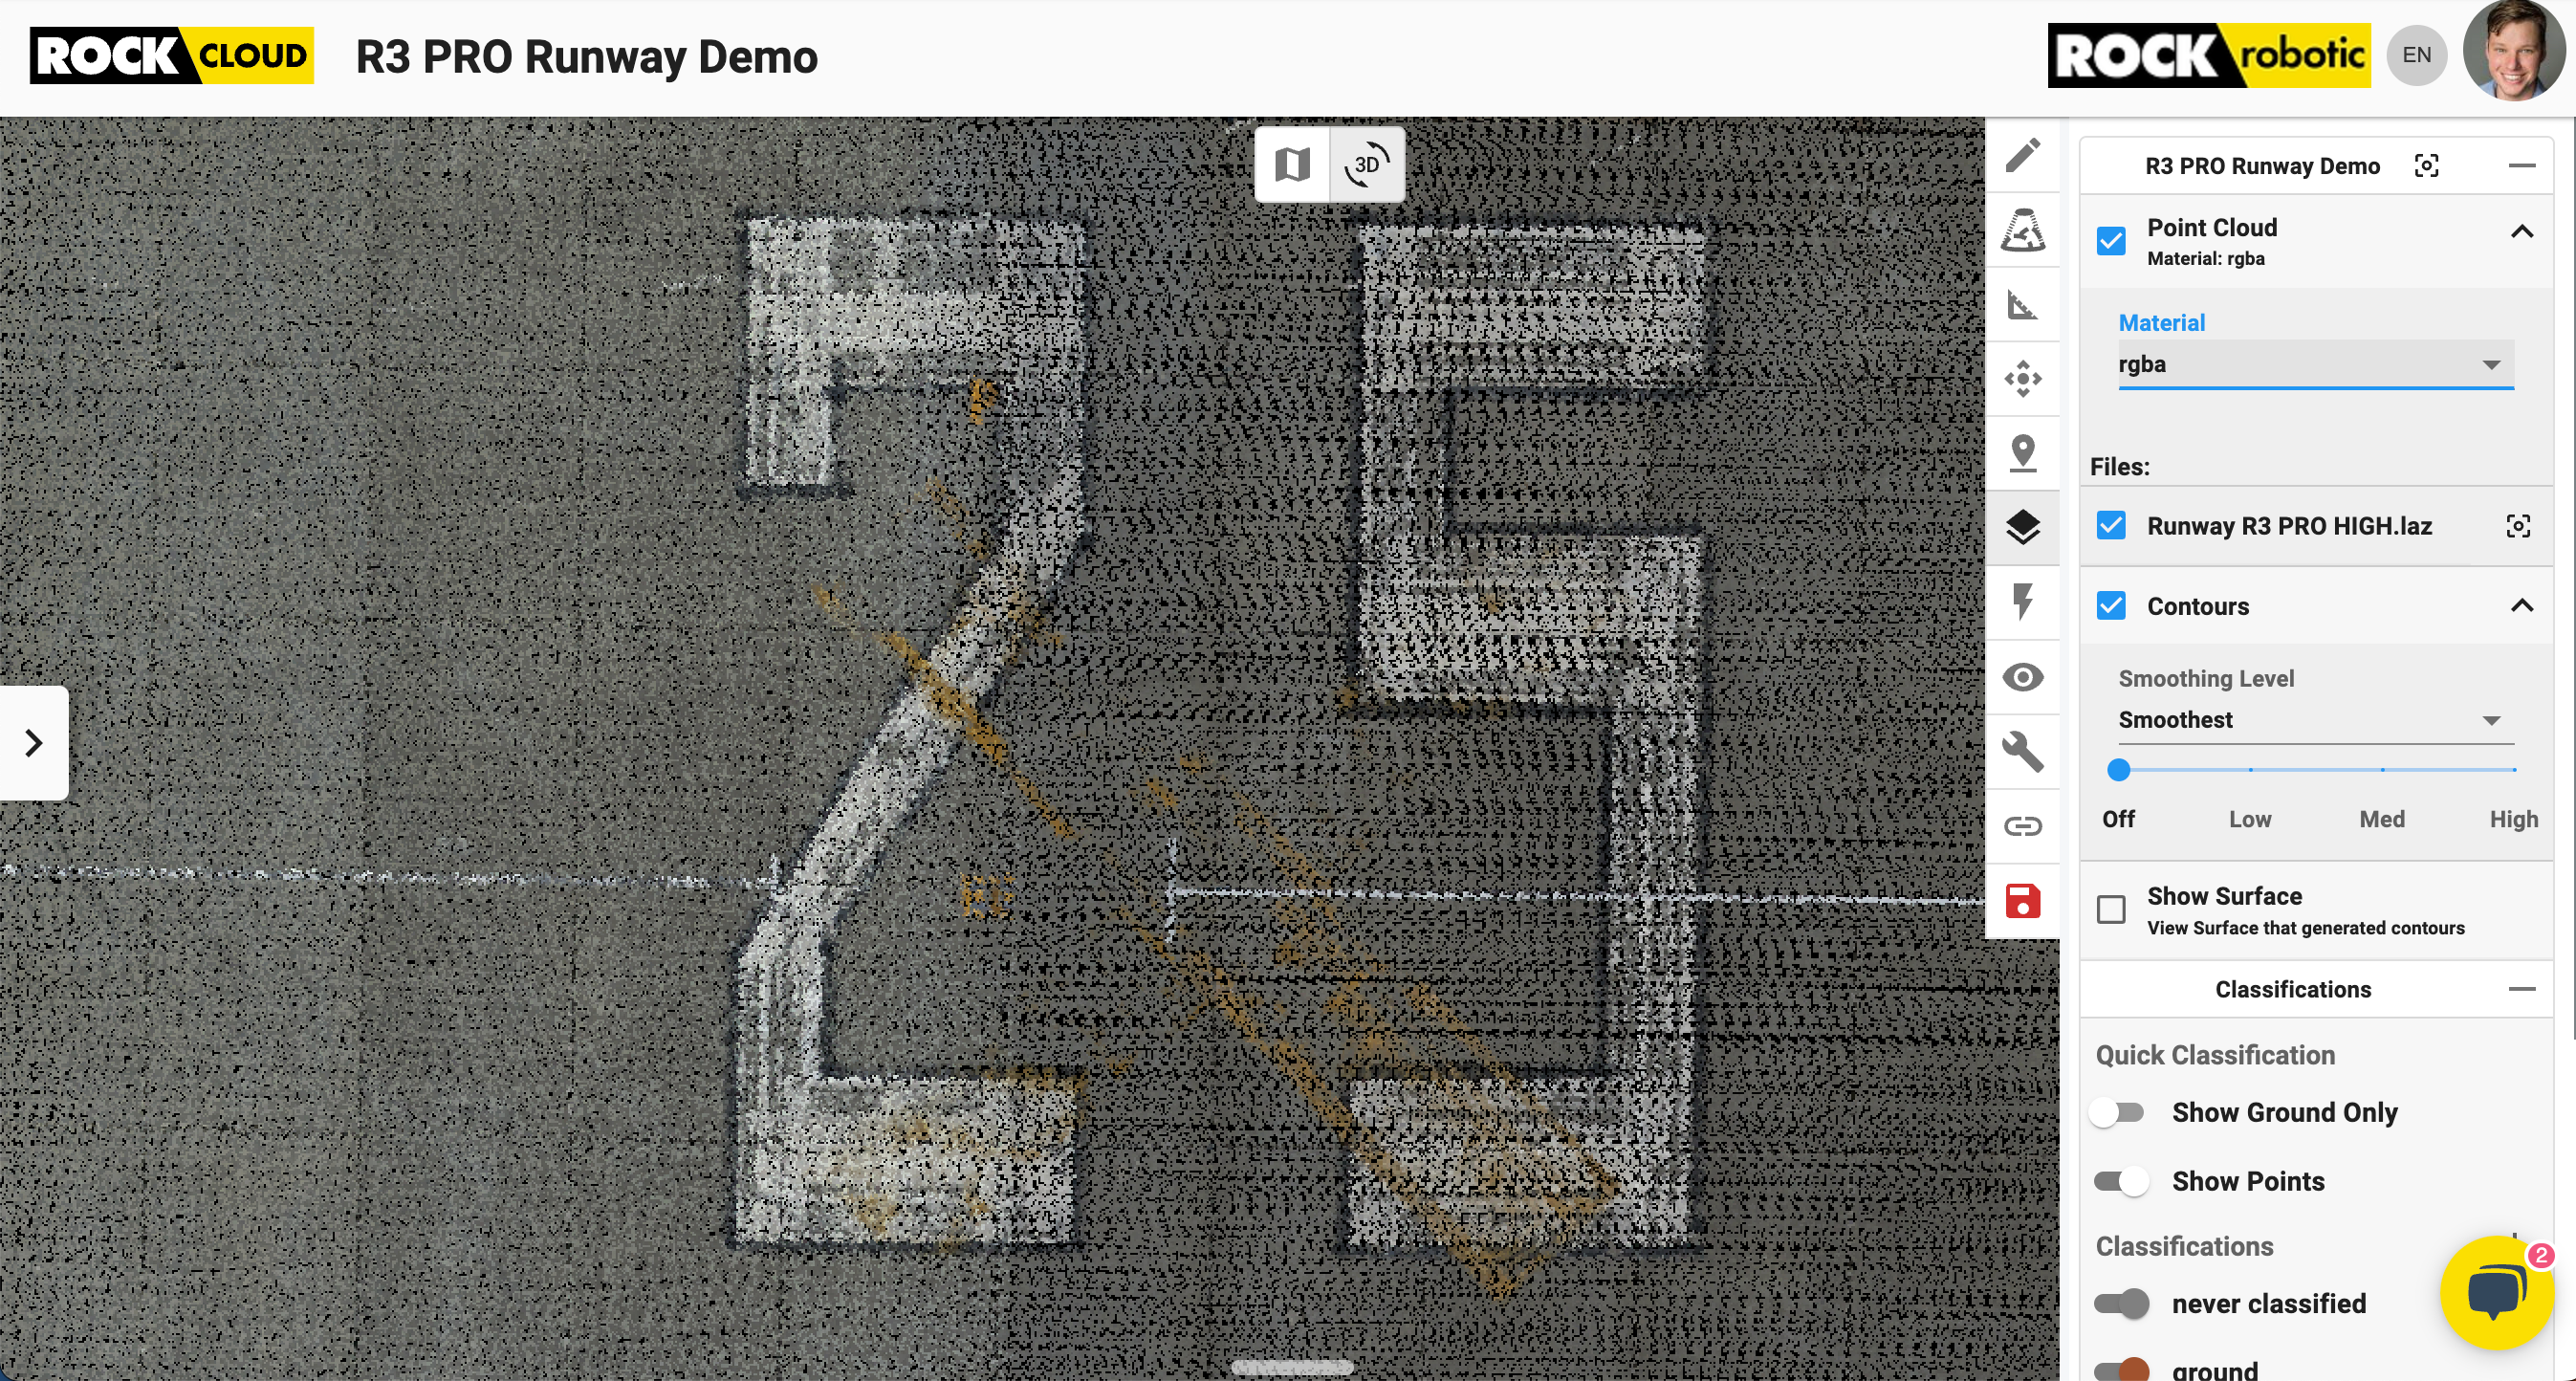
In addition to the excellent calibration, we released our new tool on the ROCK Desktop that provides a user-friendly camera alignment tool. Even if you've handled your system roughly (we're on a drone, after all), it's easy to recalibrate your system back to perfect condition.
The ROCK Revolution: Beyond the Runway
The success of this case study isn't an isolated incident. With our groundbreaking ROCK Surveyor technology, it is replicable in diverse terrains, whether it's surveying tricky terrain or inspecting power lines across California. At ROCK Robotic, we're pioneering the next generation of LiDAR technology, providing tools that are not just high performing, but also user-friendly and economical.
Wrapping Up
Well, folks, that's the wrap on our airport runway case study. From an impressive RMS of 0.034 ft to perfect strip alignment and a perfectly synced RGB camera, the ROCK R3 Pro and ROCK Cloud have proven that they are a cut above the rest. Whether it's for surveying tricky terrain or inspecting power lines, you can trust ROCK Robotic for accurate, reliable, and fast LiDAR solutions.
Further Reading & Exploring
If this case study has sparked your interest in ROCK R3 Pro and you're eager to explore its potential for your applications, we invite you to visit our online store for more information, detailed specs, and easy purchasing options. Experience first-hand how the ROCK R3 Pro can revolutionize your work with its groundbreaking precision and efficiency.
For a more visual experience, you can head over to our Indiana Drones YouTube channel. We have a video that delves into the accuracy of the ROCK R3 Pro in an entertaining and informative style. Follow this link to watch the video.
Remember, at ROCK Robotic, our mission is to make high-precision LiDAR accessible to everyone. Whether you're a surveying veteran or new to the world of drone mapping, our suite of products and solutions is designed to help you accomplish your goals faster, more accurately, and more economically.
Feel free to contact us if you have any questions or need any assistance. We're always here to help. Until then, happy flying!