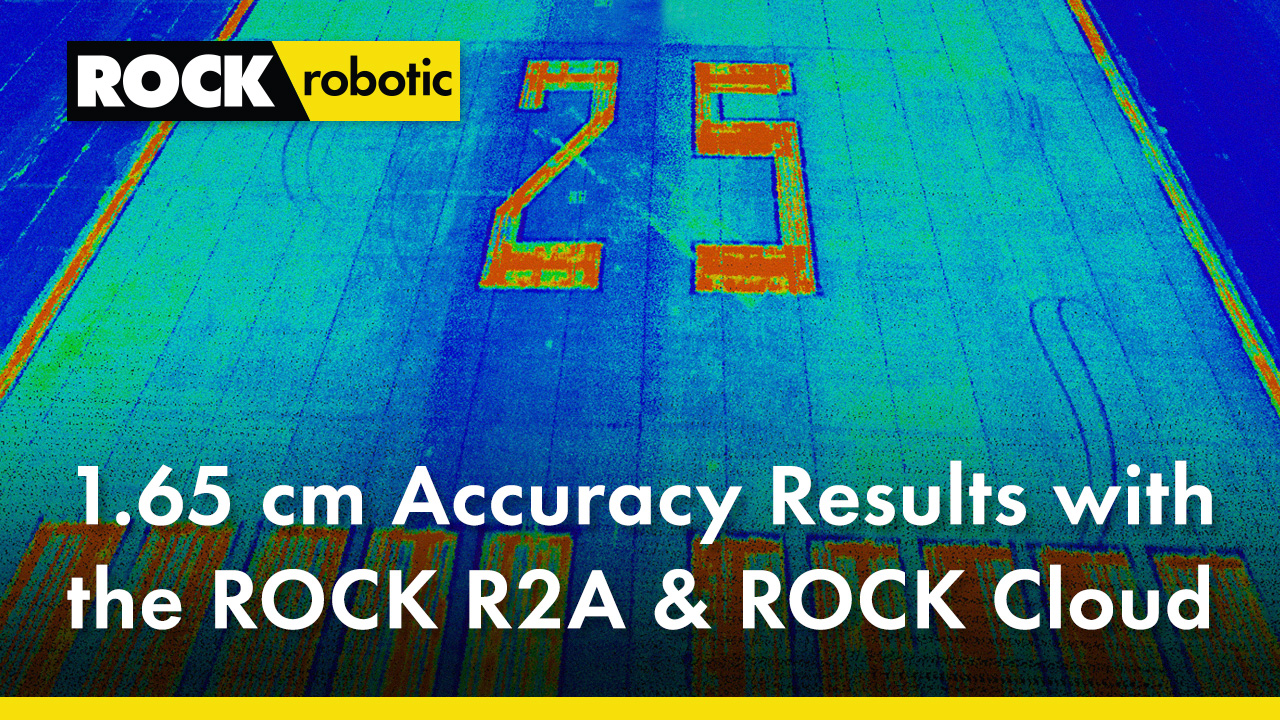
Get 1.65 cm Accuracy Results with the ROCK R2A Drone LiDAR & ROCK Cloud 3D Data Processing Software
May 26, 2022
ROCK Robotic's R2A LiDAR with the ROCK Cloud processing software can produce 1.65 cm accuracy! Bold statement, I know. So, let me break down this accuracy test flight and the procedures I used to achieve this stellar accuracy. Don't worry — you can do it too. And of course, all of the data is openly shared for you to review. 👍
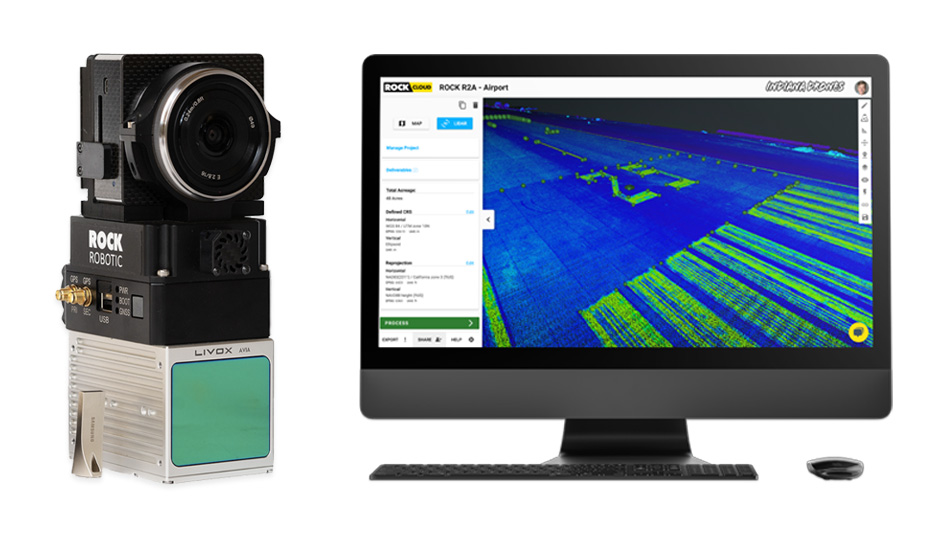
The ROCK R2A combines the best of LiDAR with photogrammetry. A lightweight solution weighing only 1.2 kg and capturing up-to 720,000 point measurements per second. With a recommended flying height (150 ft. to 400 ft.) you can capture over 2,000 acres in a single days work. Attached to the R2A LiDAR is a co-aligned 24MP Sony camera. The camera is used to both colorize the LiDAR Point Cloud and produce detailed Orthomosaics. The R2A LiDAR and Photogrammetry system is a survey machine. When used together with the ROCK Cloud, a user can easily capture data and get a Survey Grade Topographic Surfaces, Contours, and Accuracy Reports generated in a single day. This isn't the only thing you can get ... use the ROCK Cloud for Break Lines, Stockpile Volumetrics, Planimetric Line Work, or a multitude of deliverables for Power Lines. The ROCK Cloud is packed full of 3D A.I. that combs through your datasets and delivers unparalleled 3D deliverables from your LiDAR data. Use the ROCK Cloud to store, share, analyze, and process 3D Data. Not to mention — Orthomosaic support!
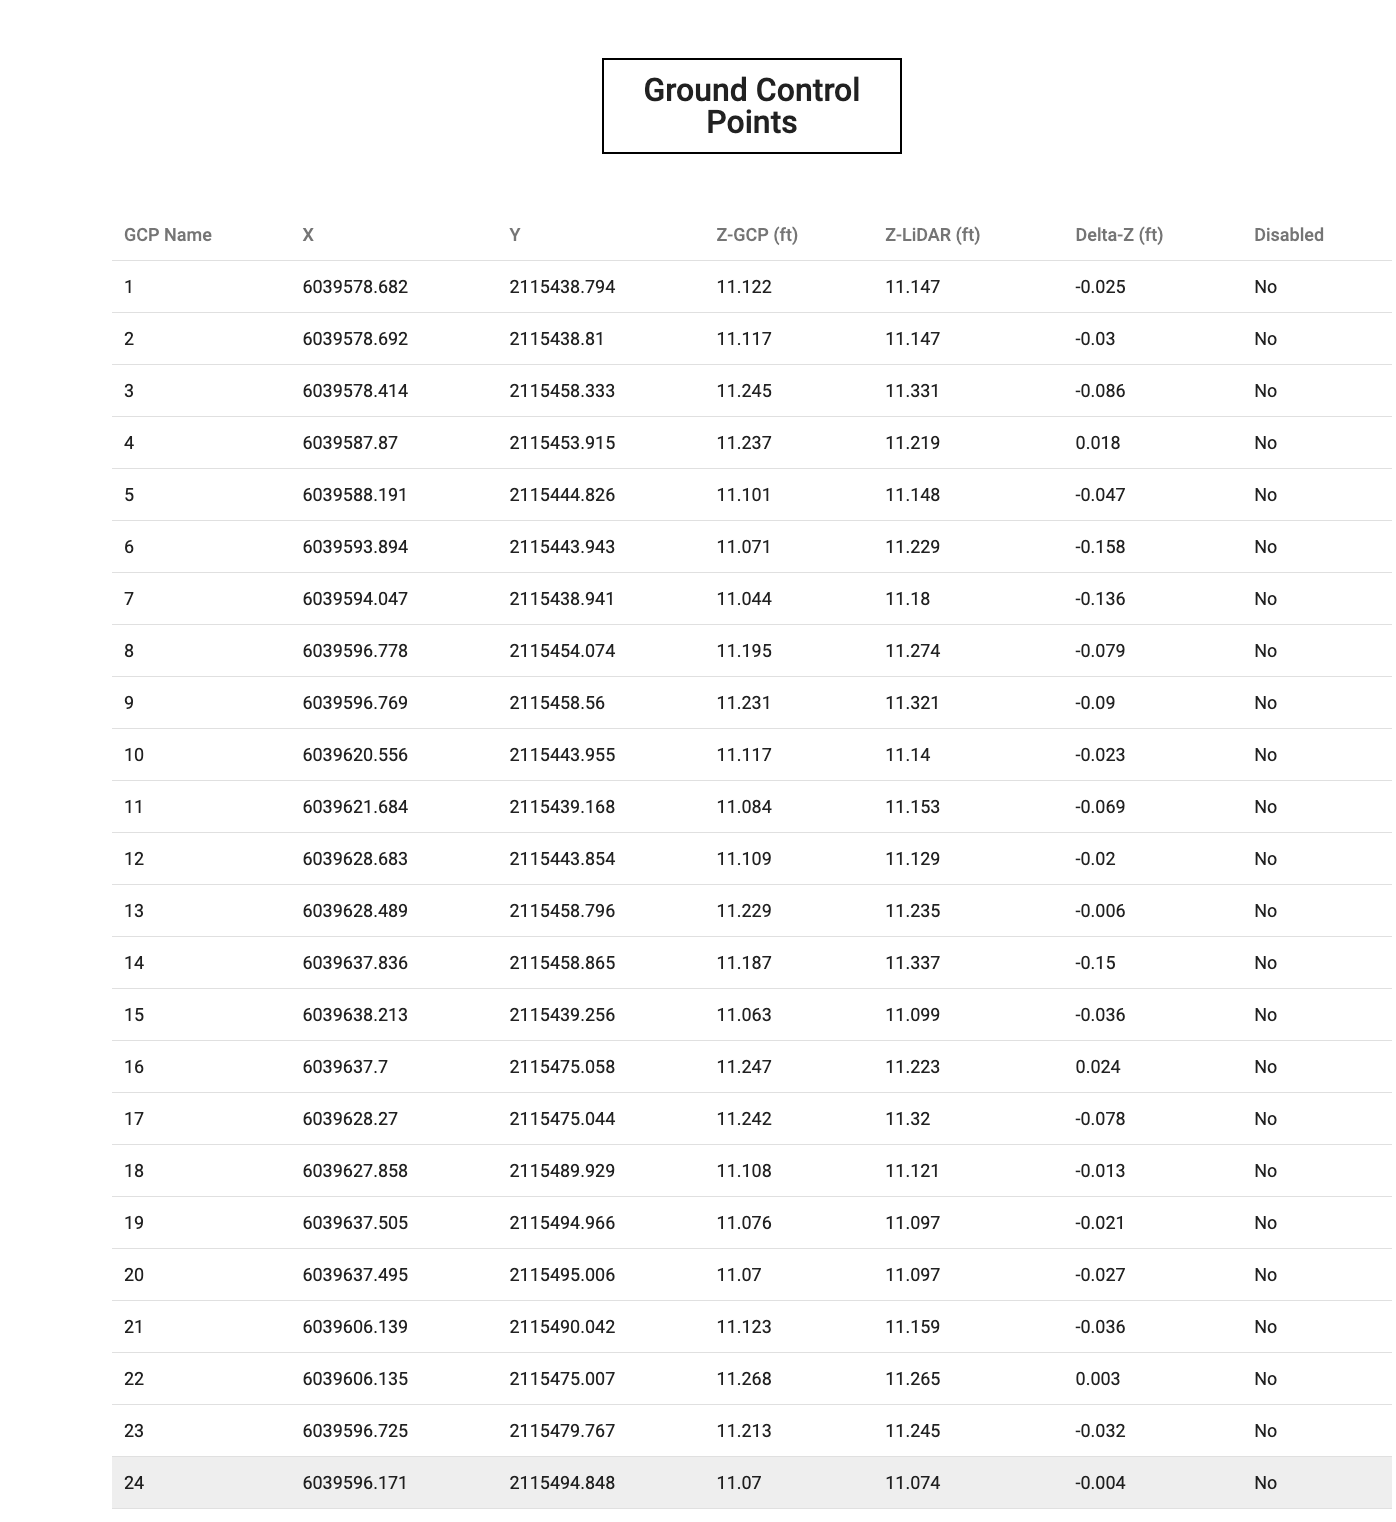
In this article, an accuracy test is conducted with the ROCK R2A and the ROCK Cloud to generate a topographic surface. The flight was conducted over an abandoned airport runway of approximately 48 acres. The airstrip was selected because of its hard and flat surface. Also, the surface is covered with highly reflective lane markings and runway numbering. The reflective lane markings were used to capturing a network of GCPs (Ground Control Points). I went a little overboard… capturing 178 control points on all the paint striping. 😳
Ground Control Points
A network of 178 GCPs is captured using two Emlid Reach RS2 GNSS systems in an RTK base and rover configuration. The base station was placed over a known monument. The location was found from the NGS database. The data sheet (Fig. 1) for the monument is pictured below. This known coordinate was entered into the base station, then RTCM3 corrections were broadcasted via 3G using the Emlid Caster service. You can learn more about the service here.
Once the base station was placed, the 178 GCPs were captured on several lane marking features on the runway. All GCPs were captured with RTK Fix and with 5 second observations per shot. This provides an average of 1-2 cm accuracy for each GCP.
Fig 1. GCP Data Sheet
Flight Overview
The ROCK R2A LiDAR was mounted to the DJI M300 drone through the quick connect Skyport. Through the Skyport connection, the R2A LiDAR gets power to operate. UGcS mission planning software was used to create an automated flight plan that was flown at an above ground level (AGL) of 50 m (164 ft), a side overlap of 30%, and a flight speed of 6 m/s (13.4 mph). The mission was flown in one battery set from the M300 drone. This flight was very simple, and nothing special was done to conduct the flight.
ROCK Cloud & The Data
As the mission was flown, the ROCK R2A captured LiDAR and orthophotos. A colorized point cloud was generated using the ROCK Desktop software - PCMaster and PCPainter. The production of the point cloud is very simple and no post calibration or strip alignment is necessary. This process took approximately 30 minutes to complete.
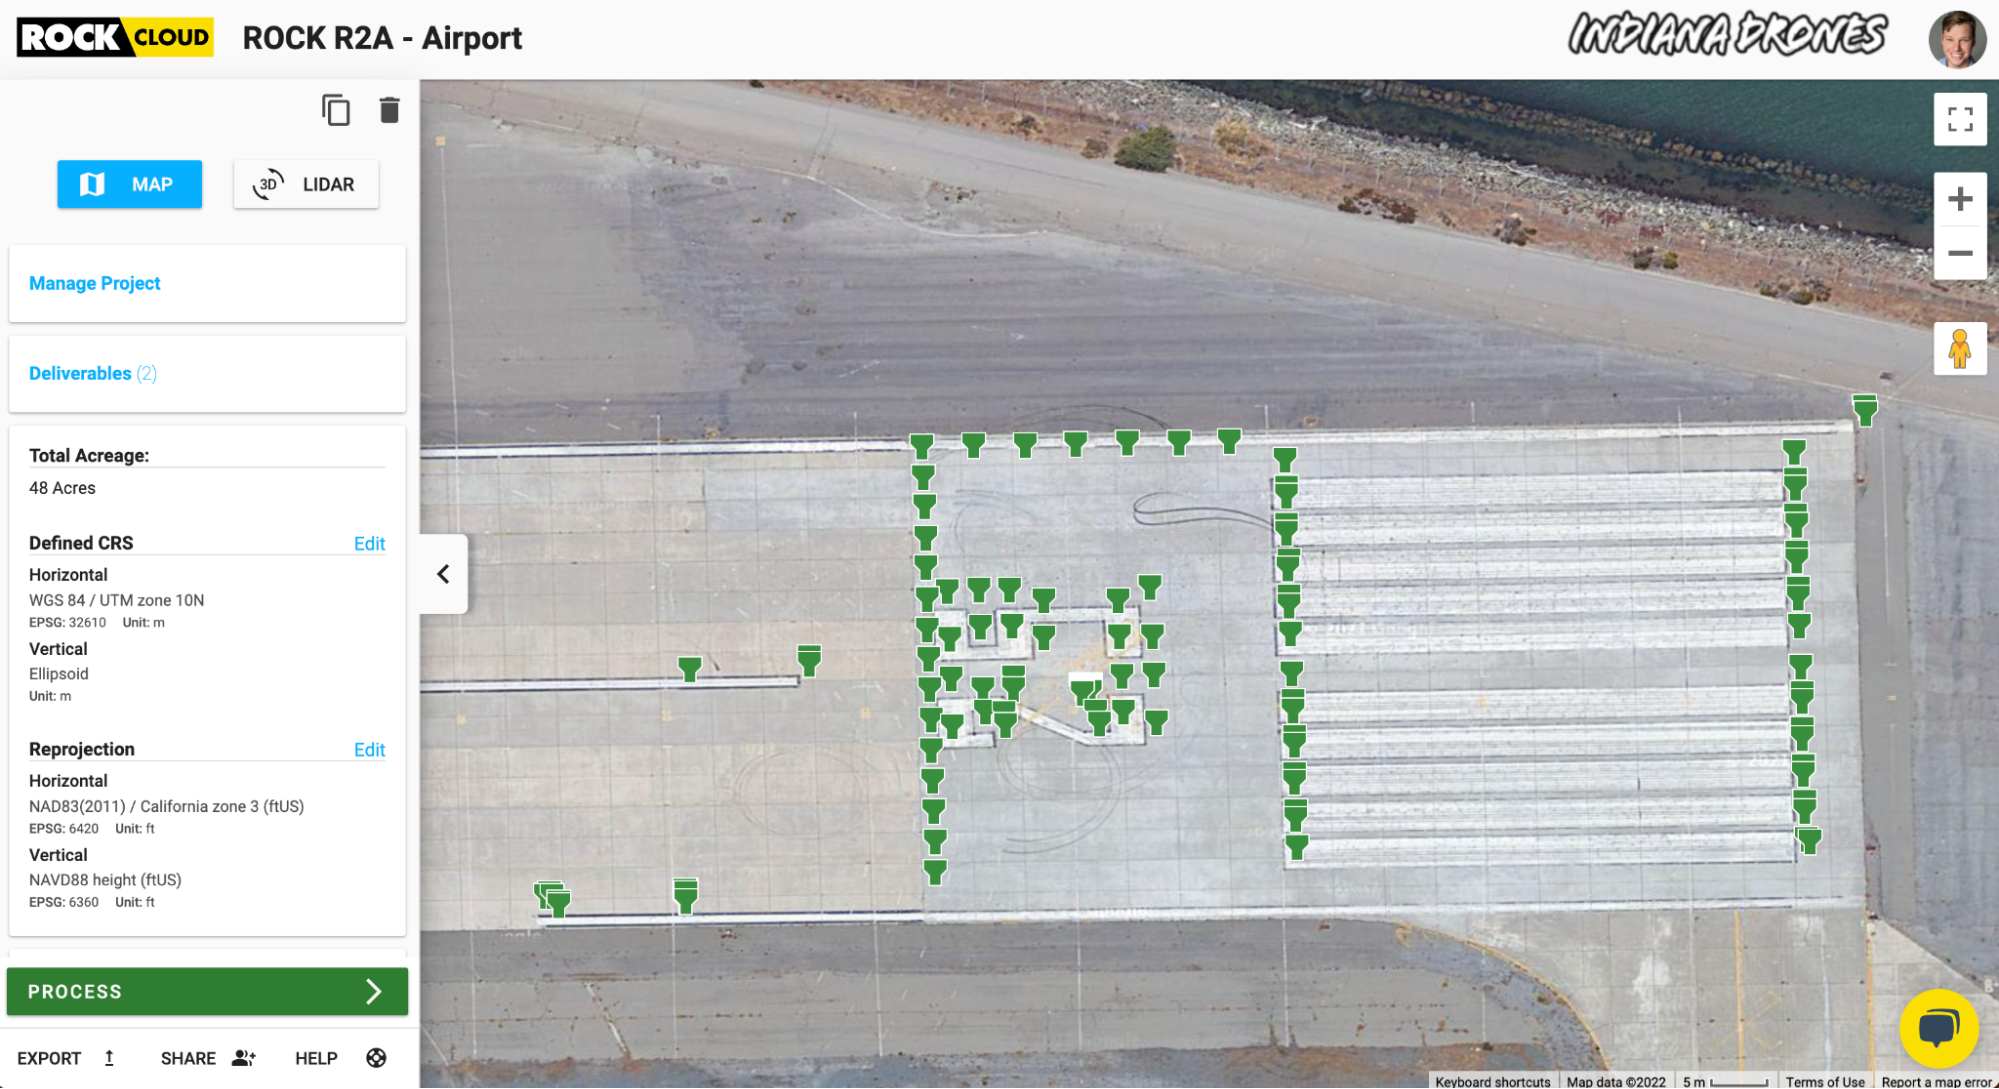
Now that we have the LAS file, we create a new project in the ROCK Cloud and upload our data. The ROCK Cloud offers a complete post processing workflow for LiDAR data as well as the ability to host, share, and analyze, and now orthomosaic support!
After uploading and selecting the local state plane projection and vertical datum: AD83(2011) / California zone 3 (ftUS) and NAVD88 height (ftUS)
ROCK Surveyor
ROCK Surveyor is a complete topographic deliverable producing engine. In one click, your data is analyzed by the ROCK A.I. engine and ground classified LiDAR dataset with digital elevation, model surface, contours, and an Accuracy Report is produced. ROCK Surveyor uses a combination of ROCK A.I. and the ROCK QC / QA team to produce final deliverables — with no user intervention. It's very simple, just click order and allow the data to process.
Accuracy Report
Here is where the story gets good! The Accuracy Report****. The Accuracy Report utilized 178 GCPs from the RTK measurements and does a vertical accuracy assessment from the GCPs to the surface generated from the ROCK R2A LiDAR and the ROCK Surveyor. The results: 57 points per square ft ( 613 pts/m^2 ), 48 acres, 0.054 ft ( 1.65 cm ) Vertical Accuracy RMS, 0.054 ft Standard Deviation, and a -0.001 ft Delta Deviation.
The big number to pull is the Vertical Accuracy RMS of 0.054 ft or 1.65 cm. This is truly astounding🥹! This is why so many surveying professionals are turning to ROCK Robotic for their high accuracy needs. The remainder of this article will discuss more on the data quality.
More notes of interest about the ROCK R2A and the ROCK Cloud:
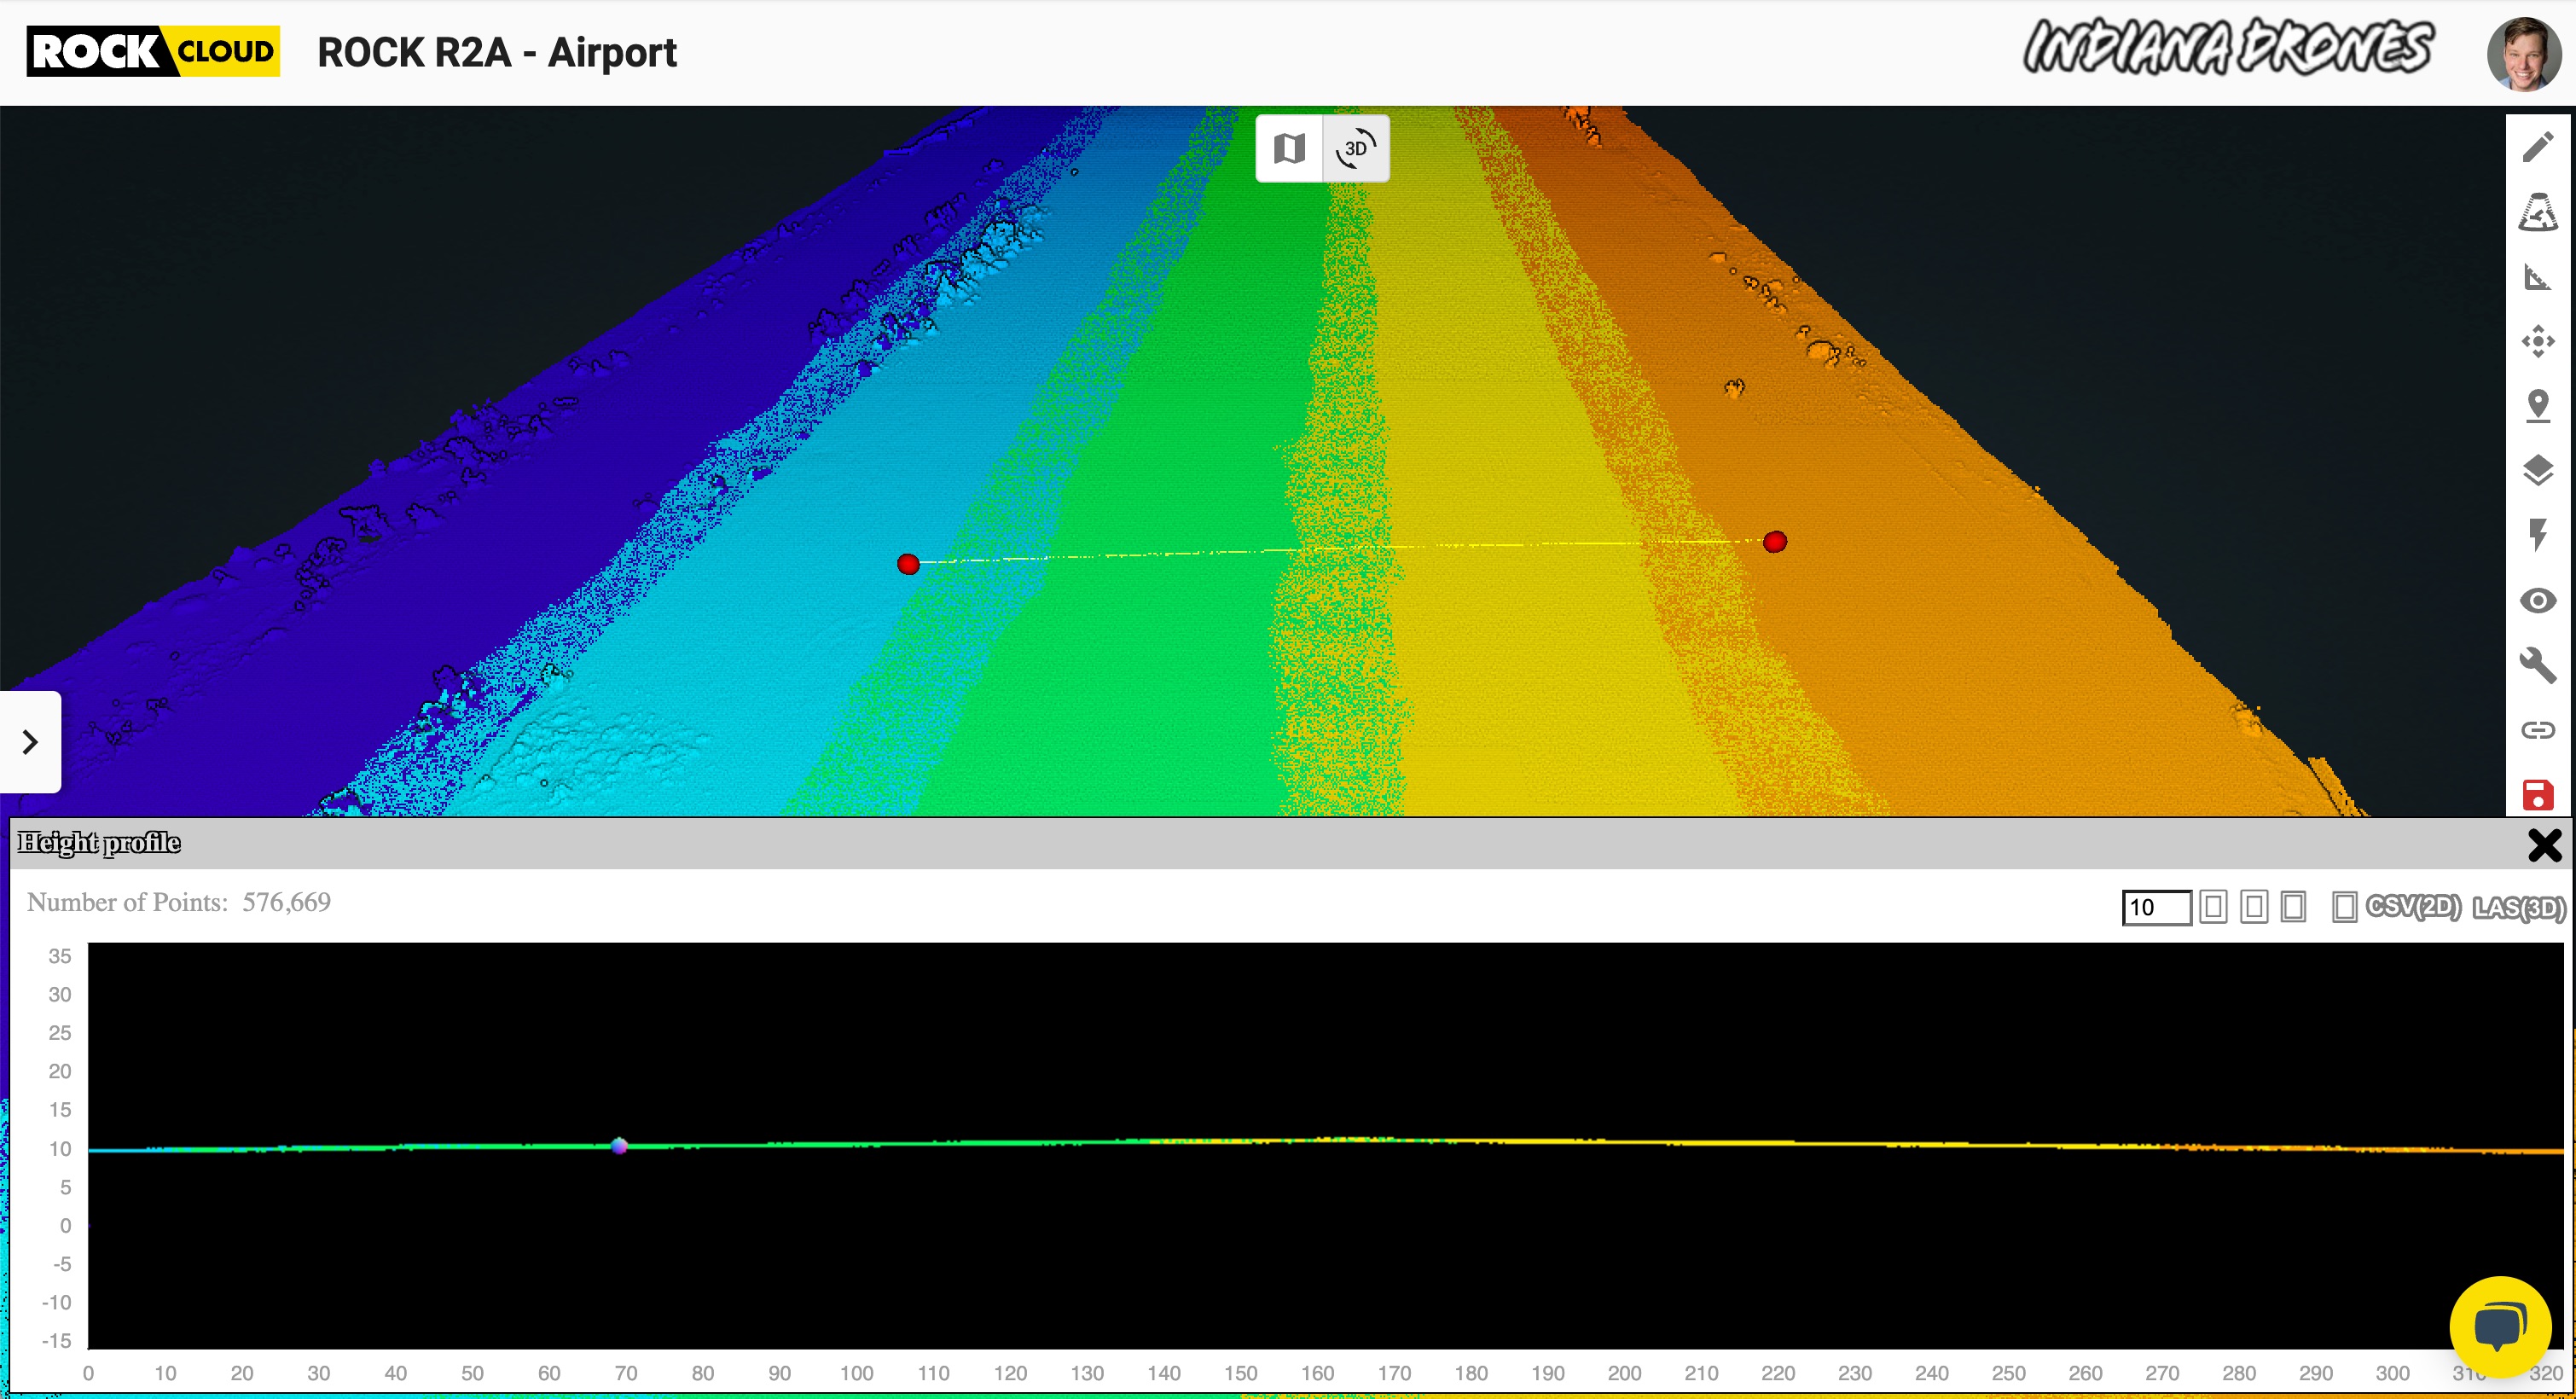
Strip Alignment
Pictured below (Fig. 2), we can see the dataset is colored from orange to purple in stripes. This is how the ROCK R2A LiDAR was flown. The variety of colors represent the time when the data was captured, allowing us to see how well the overlap is aligned. This is a very important feature of any LiDAR system. If the system quality is too poor or the system is not calibrated, then you will see mis-alignment from color to color. In the photo, you can see a cross-section profile view of the dataset. In the cross section, it is noted that there is very good alignment from strip to strip. This is a huge feature of the R2A, giving strong confidence in the solution's quality. Next, let's talk about intensity quality.
Intensity Quality
Another notable finding is the intensity view resolution quality of the data. Intensity measures how much light was returned on each measurement from the ROCK R2A LiDAR. The R2A emits a pulse of laser light that each pulse travels to the subject and reflects back to the sensor. The round trip time is used to calculate the distance from the R2A and the subject. There is additional information included in the measurement. This information is the intensity, or how much light returned. This is very important feature, as it helps differentiate objects from one another. Intensity also helps with the calibration of RGB photos to the 3D point cloud in the factory calibration during the manufacturing (or if you drop your system and need to recalibrate.).
Conclusion
Here, we’ve demonstrated an Accuracy Test of the ROCK R2A LiDAR with photogrammetry payload over an airport runway. The data was processed using the ROCK Cloud to produce the ROCK Surveyor deliverable. A network of 178 ground control points were captured with a L1/L2 RTK base rover pair to provide a trusted comparison. The Vertical RMS was calculated to be 0.054 ft (1.65 cm) verifying that the R2A and ROCK Cloud really are all that and a bag of chips.
Visit www.rockrobotic.com to learn more
about our products and services.